• | | By TelephoneBy Telephone: – If you have access to a touch-tone telephone, you may submit your proxy by dialing1-800-690-6903 and by following the recorded instructions. You will need the16-digit number included on your Notice or your proxy card in order to vote by telephone. By Mail: You may vote by mail by requesting a proxy card from us, indicating your vote by completing, signing, and dating the card where indicated and by mailing or otherwise returning the card in the envelope that will be provided to | | | | Notice of Annual Meeting of Shareholders and 2021 Proxy Statement | | | 18 |
| | | 
| | Questions and Answers About These Proxy Materials and Voting |
• | | By Mail – You may vote by mail by requesting a proxy card from us, indicating your vote by completing, signing, and dating the card where indicated and by mailing or otherwise returning the card in the envelope that will be
|
| | provided to you. You should sign your name exactly as it appears on the proxy card. If you are signing in a representative capacity (for example, as guardian, executor, trustee, custodian, attorney, or officer of a corporation), indicate your name and title or capacity.
|
| • | | Online During the Virtual Annual Meeting:In Person – You may cast your vote in person by attendingonline at the virtual Annual Meeting. We will give you a ballotMeeting during the window when you arrive.the polls are open. Even if you plan to attend the virtual meeting, we encourage you to vote by Internet, telephone, or mail in advance of the meeting so your vote will be counted if you later decide not to or cannot attend the virtual meeting. If you attend the Annual Meeting, you may then revoke your proxy and vote in person if you desire. |
We provide Internet proxy voting to allow you to vote your shareson-line, online, with procedures designed to ensure the authenticity and correctness of your proxy vote instructions. While there is no specific charge or cost to you for voting by Internet, please be aware that you must bear any costs | | | | | 14 | | | Notice of Annual Meeting of Shareholders and 2018 Proxy Statement |
| | | 
| | Questions and Answers About These Proxy Materials and Voting
|
associated with your Internet access, such as usage charges from Internet access providers and telephone companies. Internet voting online in advance of the meeting and telephone voting facilities will close at 11:59 p.m. (Eastern time) on January 28, 201924, 2022 for the voting of shares. What if I return a proxy card but do not make specific choices? If you are a shareholder of record and return a signed and dated proxy card without marking any voting selections, your shares will be voted “FOR”FOR the election of each of the nominees for director set forth in this proxy statement, “FOR” the advisory resolution on executive compensation, and “FOR”FOR the ratification of the selection of PricewaterhouseCoopers LLP as the Company’s independent registered public accounting firm for fiscal 2019.2022. If any other matter is properly presented at the meeting, your proxy (one of the individuals named on your proxy card) will vote your shares using his or her best judgment. If you are a beneficial owner of shares held in street name and return signed and dated voting instructions without marking any voting selections, your shares may be voted at the discretion of your broker with respect to the ratification of the selection of PricewaterhouseCoopers LLP as the Company’s independent registered public accounting firm for fiscal 20192022 (Proposal No. 3) but may not be voted with respect to the election of directors (Proposal No. 1), or the advisory vote related to executive compensation (Proposal No. 2). If any matter which is considered routine is properly presented at the meeting, your proxy (one of the individuals named on the proxy card) will vote your shares using his or her best judgment. Please return your voting instructions with your voting selections marked so that your vote can be counted. What constitutes a quorum? Holders of Class A common stock and Class B common stock will vote together as a single class on all matters voted on at the Annual Meeting, and each share is entitled to one vote. A majority of the total outstanding shares of Class A and Class B common stock must be present or represented by proxy to constitute a quorum at the Annual Meeting. Shares voted by proxy on any matter (including shares voted pursuant to a broker’s discretionary voting authority) are counted as present at the meeting for purposes of determining a quorum. How many votes are required to approve each proposal? The election of directors (Proposal No. 1) will be determined by a plurality of the votes cast by the shares entitled to vote in the election at the meeting, assuming a quorum is present. A plurality vote requirement means that the threetwo director nominees with the greatest number of votes cast, even if less than a majority, will be elected. There is no cumulative voting. The advisory vote on executive compensation (Proposal No. 2) will be approved if the votes cast favoring the proposal exceed the votes cast opposing the proposal. While the vote on executive compensation (Proposal No. 2) is advisory in nature andnon-binding, the Board and the Compensation Committee will review the voting results and intend to carefully consider the results when making future decisions regarding executive compensation. The ratification of the selection of the independent registered public accounting firm (Proposal No. 3) will be approved if the votes cast favoring the proposal exceed the votes cast opposing the proposal. | | | | Notice of Annual Meeting of Shareholders and 2021 Proxy Statement | | | 19 |
| | |
| | Questions and Answers About These Proxy Materials and Voting |
How are votes counted? With respect to the election of directors, you may vote “FOR” or “WITHHOLD” with respect to each nominee. Votes that are withheld will be excluded entirely from the vote with respect to the nominee from which they are withheld. Votes that are withheld will not have any effect on the outcome of the election of directors. You may vote “FOR”, “AGAINST”, or “ABSTAIN” with respect to the advisory vote on executive compensation (Proposal No. 2), and the vote on the ratification of the selection of the independent registered public accounting firm (Proposal No. 3). For Proposal Nos. 2 and 3, abstentions will not have any effect on the outcome of the vote. | | | | | | | Notice of Annual Meeting of Shareholders and 2018 Proxy Statement | | | | 15 | |
| | |
| | Questions and Answers About These Proxy Materials and Voting
|
What is a “brokernon-vote” and how does it affect voting on each item? A broker who holds shares for a beneficial owner has the discretion to vote on “routine” proposals when the broker has not received voting instructions from the beneficial owner. A “brokernon-vote” occurs when shares held by a broker are not voted with respect to a proposal because (1) the broker has not received voting instructions from the shareholder who beneficially owns the shares and (2) the broker lacks discretionary authority to vote the shares for that particular matter. Each of Proposal No. 1 (election of directors), and Proposal No. 2 (advisory vote on executive compensation) are considered to benon-routine matters, and brokers therefore lack discretionary authority to vote shares on such matters at this meeting. Brokernon-votes, like other shares that are not voted at the meeting, have no effect on the outcome of the vote on such matters. Can I change my vote after submitting my proxy? Yes. You can revoke your proxy at any time before the final vote at the meeting. You may revoke your proxy in any one of the following five ways: You may submit another properly completed proxy card with a later date that is received prior to the taking of the vote at the Annual Meeting. You may vote again on the Internet or by telephone before the closing of those voting facilities at 11:59 p.m. (Eastern time) on January 28, 201924, 2022 (only your latest Internet or telephone proxy submitted prior to the Annual Meeting will be counted). You may provide a written notice that you are revoking your proxy to the Company’s Corporate Secretary at Schnitzer Steel Industries, Inc., 299 SW Clay Street, Suite 350, Portland, Oregon 97201, Attention: Corporate Secretary. | | Steel Industries, Inc., 299 SW Clay Street, Suite 350, Portland, Oregon 97201, Attention: Corporate Secretary, or hand-deliver it to the Corporate Secretary at or before the taking of the vote at the Annual Meeting.
|
You may attendvote online during the virtual Annual Meeting revokeby entering the 16-digit control number found on your proxy and vote in person.card, voting instruction form, or Notice, as applicable. Simply attending the virtual Annual Meeting will not, by itself, revoke your proxy. Remember that if you are a beneficial owner of Company shares holding shares in a street name, you may submit new voting instructions by contacting your bank, broker, or other nominee. You may also change your vote or revoke your proxy in person atonline during the virtual Annual Meeting ifafter you obtain a validlog-in by entering the 16-digit control number found on your Notice, voter instruction form, or proxy from the organization that is the record owner of your shares (such as your broker)card at www.virtualshareholdermeeting.com/SCHN2022. | | | | | 16 | | | Notice of Annual Meeting of Shareholders and 20182021 Proxy Statement | | | 20 |
Virtual Meeting Information Due to public health concerns relating to COVID-19 and to support the health and safety of our shareholders and employees, the Annual Meeting will be a virtual meeting, conducted exclusively via live audio webcast at www.virtualshareholdermeeting.com/SCHN2022. There will not be a physical location for the Annual Meeting, and you will not be able to attend the meeting in person. To participate in the virtual meeting, please visit www.virtualshareholdermeeting.com/SCHN2022 and enter the 16-digit control number included in your Notice, on your proxy card, or on the voting instruction form that accompanied your proxy materials. You may begin to log into the meeting platform beginning at 7:45 a.m. Pacific Time on Tuesday, January 25, 2022. The meeting audio webcast will begin promptly at 8:00 a.m. Pacific Time on Tuesday, January 25, 2022. The virtual meeting platform is fully supported across browsers and devices running the most updated version of applicable software and plug-ins. Please ensure that you have a strong Wi-Fi connection wherever you intend to participate in the meeting. Please also give yourself sufficient time to log-in and ensure you can hear the streaming audio before the meeting starts. Shareholders will be able to submit questions live during the virtual meeting by typing the question into the “Ask a Question” field, and clicking submit. We will answer questions that comply with the meeting rules of conduct during the Annual Meeting, subject to time constraints. If we receive substantially similar questions, we will group such questions together. Questions relevant to meeting matters that we do not have time to answer during the meeting will be posted to our website following the meeting. Questions regarding personal matters or matters not relevant to meeting matters will not be answered. Our rules of conduct will be posted at www.virtualshareholdermeeting.com/SCHN2022 at the outset of the Annual Meeting. If you encounter any technical difficulties with the virtual meeting website on the meeting day, please call the technical support number that will be posted on the virtual meeting log-in page. Technical support will be available starting at 7:45 a.m. Pacific Time and until the meeting has finished. At this time, we do not intend for this to be a permanent shift from in-person meetings. | | | | Notice of Annual Meeting of Shareholders and 2021 Proxy Statement | | | 21 |
Voting Securities and Principal Shareholders The record date for determining shareholders entitled to receive notice of and to vote at the Annual Meeting was December 3, 2018.November 29, 2021. At the close of business on December 3, 2018,November 29, 2021, a total of 27,026,15227,823,708 shares of our common stock, par value $1.00 per share, were outstanding and entitled to vote at the Annual Meeting. The outstanding common stock consisted of 26,826,15227,623,708 shares of Class A common stock (Class A) and 200,000 shares of Class B common stock (Class B). Each share of common stock (whether Class A or Class B) is entitled to one vote with respect to each matter to be voted on at the Annual Meeting. The following table sets forth certain information regarding the beneficial ownership of our common stock as of November 30, 201829, 2021 (unless otherwise noted in the footnotes to the table) by (i) persons known to us to be the beneficial owner of more than 5% of our common stock, (ii) each of our current directors, (iii) each nominee for director, (iv) each of our executive officersthe individuals listed in the Summary Compensation Table (each, a “named executive officer” and, collectively, the “named executive officers”), and (v) all of our current directors and executive officers as a group. Unless otherwise noted in the footnotes to the table, the persons named in the table have sole voting and investment power with respect to all outstanding shares of common stock shown as beneficially owned by them. Except as noted below, the address of each shareholder in the table is c/o Schnitzer Steel Industries, Inc., 299 SW Clay Street, Suite 350, Portland, Oregon 97201. Each Class B share is convertible into one Class A share, and there are no meaningful distinctions between the rights of holders of Class A shares and Class B shares. Accordingly, the following table reports beneficial ownership of common stock in the aggregate and does not distinguish between Class A shares and Class B shares. | | | | | | | | | Common Stock Beneficially Owned | | | | | Common Stock
Beneficially Owned | | | | Name of Beneficial Owner or Number of Persons in Group | | Number | | | Percent | | | Number | | Percent | | BlackRock Institutional Trust Company, N.A. | | | | 3,053,268 | (1) | | | 11.0 | % | The Vanguard Group, Inc. | | | 2,749,343 | (1) | | | 10.2 | % | | | 2,235,629 | (2) | | | 8.0 | % | BlackRock Institutional Trust Company, N.A. | | | 2,736,803 | (2) | | | 10.1 | % | | Dimensional Fund Advisors, L.P. | | | 2,265,024 | (3) | | | 8.4 | % | | | 2,214,749 | (3) | | | 8.0 | % | John D. Carter | | | 116,390 | | | | * | | | State Street Corp. | | | | 1,440,925 | (4) | | | 5.2 | % | Ameriprise Financial Inc. | | | | 1,407,905 | (5) | | | 5.1 | % | Wayland R. Hicks | | | 75,744 | (4) | | | * | | | | 106,874 | (6) | | | * | | Rhonda D. Hunter | | | 1,086 | (5) | | | * | | | | 21,540 | (7) | | | * | | David L. Jahnke | | | 33,393 | (6) | | | * | | | | 56,908 | (8) | | | * | | Judith A. Johansen | | | 52,933 | (7) | | | * | | | | 78,299 | (9) | | | * | | William D. Larsson | | | 53,933 | (8) | | | * | | | | 79,299 | (10) | | | * | | Glenda J. Minor | | | | 5,184 | (11) | | | * | | Michael W. Sutherlin | | | 21,159 | (9) | | | * | | | | 43,515 | (12) | | | * | | Tamara L. Lundgren | | | 516,867 | | | | 1.9 | % | | | 849,792 | | | | 3.1 | % | Richard D. Peach | | | 85,920 | | | | * | | | | 148,605 | | | | * | | Jeffrey Dyck | | | 61,034 | | | | * | | | Michael R. Henderson | | | | 87,613 | | | | * | | Steven G. Heiskell | | | 34,333 | | | | * | | | | 78,244 | | | | * | | Michael R. Henderson | | | 42,977 | | | | * | | | | | | | | | Peter B. Saba | | | | 37,066 | | | | * | | All current directors and executive officers as a group (14 persons) | | | 1,117,288 | | | | 4.1 | % | | | 1,734,805 | | | | 6.2 | % |
| (1) | Beneficial ownership as of MayDecember 31, 20182020 as reported by BlackRock Inc., 55 East 52nd Street, New York, NY 10055 in a Form 13G/A filed by the shareholder. |
| (2) | Beneficial ownership as of December 31, 2020 as reported by Vanguard Group, Inc., 100 Vanguard Blvd., Malvern, PA 19355 in a Form 13G/A filed by the shareholder. |
(2) | Beneficial ownership as of December 31, 2017 as reported by BlackRock Inc., 55 East 52nd Street, New York, NY 10055 in a Form 13G/A filed by the shareholder.
|
| (3) | Beneficial ownership as of December 31, 20172020 as reported by Dimensional Fund Advisors LP, 6300 Bee Cave Road, Building One, Austin, TX 78746 in a Form 13G/A filed by the shareholder. |
| (4) | Beneficial ownership as of December 31, 2020 as reported by State Street Corp., One Lincoln Street, Boston, MA 02111 in a Form 13G filed by the shareholder. |
| (5) | Beneficial ownership as of December 31, 2020 as reported by Ameriprise Financial Inc., 145 Ameriprise Financial Center, Minneapolis, MN 55474 in a Form 13G filed by the shareholder. |
| (6) | Includes 68,64495,768 shares covered by vested deferred stock units (“DSUs”) or credited to an accountand 4,006 shares covered by unvested DSUs that will vest on January 24, 2022 under the Deferred Compensation Plan forNon-Employee Directors (the “Director DCP”). See footnote 2 to the Directors Compensation Table on page 2937 for additional information. |
(5)(7) | Includes 1,08617,534 shares covered by vested deferred stock units (“DSUs”) and 4,006 shares covered by unvested DSUs that are issuable to such director pursuant to vested DSUswill vest on January 24, 2022 under the Director DCP.Deferred Compensation Plan for Non-Employee Directors (the “Director DCP”). |
(6)(8) | Includes 33,39352,902 shares covered by vested deferred stock units (“DSUs”) and 4,006 shares covered by unvested DSUs that are issuable to such director pursuant to vested DSUswill vest on January 24, 2022 under the Director DCP.Deferred Compensation Plan for Non-Employee Directors (the “Director DCP”). |
| | | | | | | Notice of Annual Meeting of Shareholders and 20182021 Proxy Statement | | | | 17 | 22 |
| | |
| | Voting Securities and Principal Shareholders |
(7) | Includes 52,933 shares that are issuable to such director pursuant to vested DSUs under the Director DCP.
|
(8) | Includes 52,933 shares that are issuable to such director pursuant to vested DSUs under the Director DCP.
|
| (9) | Includes 21,15974,293 shares covered by vested deferred stock units (“DSUs”) and 4,006 shares covered by unvested DSUs that are issuable to such director pursuant to vested DSUswill vest on January 24, 2022 under the Director DCP.Deferred Compensation Plan for Non-Employee Directors (the “Director DCP”). |
Section 16(a) Beneficial Ownership Reporting Compliance
| (10) | Includes 74,293 shares covered by vested deferred stock units (“DSUs”) and 4,006 shares covered by unvested DSUs that will vest on January 24, 2022 under the Deferred Compensation Plan for Non-Employee Directors (the “Director DCP”). |
Section 16(a) of the Securities Exchange Act of 1934 requires our directors, executive officers, and persons who beneficially own more than 10% of our outstanding common stock to file with the SEC reports of beneficial ownership and changes in beneficial ownership of our common stock held by such persons. Executive officers, directors, and greater than 10%
shareholders are also required to furnish us copies of all forms they file under this regulation. To our knowledge, based solely on a review of the copies of such reports furnished to us and representations that no other reports were required during fiscal 2018, we believe that all required Section 16(a) reports were timely filed for such fiscal year.
| (11) | Includes 1,178 shares covered by vested deferred stock units (“DSUs”) and 4,006 shares covered by unvested DSUs that will vest on January 24, 2022 under the Deferred Compensation Plan for Non-Employee Directors (the “Director DCP”). |
Certain Transactions
The Audit Committee charter requires the Audit Committee to review any reportable transaction or proposed transaction with a related person, or in which a related person has a direct or indirect interest, and determine whether to ratify or approve the transaction, with ratification or approval to occur only if the Audit Committee determines that the transaction is fair to the Company or that approval or ratification of the transaction is in the interest of the Company.
One of our executive officers, Michael Henderson, has an immediate family member, Brian Henderson, who is employed by a subsidiary of the Company. The compensation
of Brian Henderson was established by the Company in accordance with its employment and compensation practices applicable to employees with equivalent qualifications and responsibilities and holding similar positions. Michael Henderson does not have a material interest in the employment relationship nor does he share a household with the employee. Brian Henderson received fiscal 2018 compensation of $173,800. There were no other reportable related person transactions during fiscal 2018.
| (12) | Includes 39,509 shares covered by vested deferred stock units (“DSUs”) and 4,006 shares covered by unvested DSUs that will vest on January 24, 2022 under the Deferred Compensation Plan for Non-Employee Directors (the “Director DCP”). |
| | | | | 18 | | | Notice of Annual Meeting of Shareholders and 20182021 Proxy Statement | | | 23 |
Proposal No. 1 – Election of Directors We are asking shareholders to elect the threetwo individuals nominated by the Board, each of whom is a current director. The Board currently consists of eight members divided into three classes pursuant to our 2006 Restated Articles of Incorporation and Restated Bylaws. One class of directors is elected each year for a three-year term. The term of Class I directors expires at the 2019 annual meeting;2022 Annual Meeting; the term of Class II directors expires at the 20202023 annual meeting; and the term of Class III directors expires at the 20212024 annual meeting. Generally, the terms of directors continue until their respective successors are duly elected and qualified. Action will be taken at the 20192022 Annual Meeting to elect threetwo Class I directors to serve until the 20222025 annual meeting of shareholders. Following consideration of William D. Larsson’s indication of interest in retiring from the Board at the end of his term in accordance with the Company’s term limit policy, Mr. Larsson, a current Class I director, has not been re-nominated for election as a director, and his term as a director will end at the 2022 Annual Meeting. The Board of Directors has approved a decrease in the number of directors from eight to seven effective immediately prior to the 2022 Annual Meeting. The nominees for election at the 20192022 Annual Meeting are Rhonda D. Hunter and David L. Jahnke and William D. Larsson as Class I directors. The Board has determined that Ms. Hunter and Messrs.Mr. Jahnke and Larsson qualify as independent directors under our Corporate Governance Guidelines, SEC rules, and NASDAQ requirements. If any nominee is unable to stand for election, the persons named in the proxy will vote the proxy for a substitute nominee in accordance with the recommendation of the Board. We are not aware of any nominee who is or will be unable to stand for election. Class I Director Nominees | | | | | | | | | | | | | |  
| | Rhonda D. Hunter Age: 5659 Director Since: 2017 | | Company Board Committees: • Audit; NominatingCompensation Other Public Company Directorships: • Interfor Corporation, Member of the Management Resources & Compensation Committee and Chair of the Corporate Governance, Responsibility & Nominating Committee Qualifications and Skills to Serve as a Director: | | | | | | | | • Experience as a senior executive at a commodities-based public company • Expertise in inventory and planning, environmental and work systems, finance and accounting, international business, strategic planning, growth management, operational integration, and operations | | | | | | | | | | • Public company board and committee experience |
Ms. Hunterwas Senior Vice President, Timberlands, of Weyerhaeuser Company, a North American timberland company, from 2014 until her retirement in January 2018.2019. Ms. Hunter was Vice President, Southern Timberlands, of Weyerhaeuser from 2010 to 2014. Ms. Hunter previously held a number of financial and operational leadership positions within Weyerhaeuser with increasing P&L responsibility. Ms. Hunter joined Weyerhaeuser in 1987 as an accountant. Ms. Hunter holds a Bachelor of Science in Accounting from Henderson State University and has completed executive education at Harvard Business School and Duke University. | | | | Notice of Annual Meeting of Shareholders and 2021 Proxy Statement | | | 24 |
| | |
| | Proposal No. 1 – Election of Directors |
| | | | | | | | | | 
| | | |  | | David L. Jahnke Age:6568 Director Since:2013 | | Company Board Committees: • Audit, Chair; Compensation Other Public Company Directorships: • First Interstate BancSystem, Inc., Chair of Board; Chair of the Executive Committee and Member of the Governance & Nominating Committee Qualifications and Skills to Serve as a Director: | | Other Public Company
Directorships:
• First Interstate BancSystem, Inc. Member of Executive Committee, Risk Committee and Chair of Audit Committee
| | | | | | • Public accounting, financial reporting, and internal controls experience • Experience in complex financial transactions, international business and executive compensation • Public company board and committee leadership experience | | | | | | | | | | |
Mr. Jahnkeheld various positions at KPMG, the international accounting firm, from 1975 until 2010. From 2005 to 2010, he was the Global Lead Partner for a major KPMG client and was located in KPMG’s Zurich, Switzerland office. Prior to that time, he held positions of increasing responsibility at KPMG, including Office Managing Partner and Audit Partner in Charge of the Minneapolis office from 1999 to 2004. He is a director of Swiss Re America Holding Corporation where he serves as Chair of its Audit Committee and is a member of its Executive Committee. Mr. Jahnke holds a B.S. in Accounting from the University of Minnesota-Twin Cities. | | | | | | | Notice of Annual Meeting of Shareholders and 2018 Proxy Statement | | | | 19 | |
| | |
| | Proposal No. 1 – Election of Directors
|
| | | | | | | | | | | | | |  | | William D. Larsson
Age:73
Director Since:2006
| | Company Board Committees:
• Nominating and Corporate Governance, Chair; Audit
Qualifications and Skills to Serve as a Director:
| | Other Public Company
Directorships:
• Clearwater Paper Corporation, Vice-Chair of Board and Chair of Audit Committee
| | | | | | • Former public company Chief Financial Officer
• Experience in general manufacturing, international business, mergers and acquisitions, executive compensation, strategic analysis, and growth management and organizational integration
• Public company board and committee leadership experience
| | | | | | | | | | |
Mr. Larsson was Senior Vice President and Chief Financial Officer from 2000 until 2009, of Precision Castparts Corp., a leading manufacturer of complex metal components and products principally for the aerospace and power generation
industries. He earned a B.S. in Economics and a B.S. in Mathematics from the University of Oregon and an MBA from California State University at Long Beach.
Vote Required to Elect Directors Holders of Class A Common Stock and Class B Common Stock will vote together as a single class on this matter, and each share is entitled to one vote for each director nominee. Directors are elected by a plurality of the votes of the shares present in person or represented by proxy at the meeting and entitled to vote on the election of directors. Proxies received from shareholders of record, unless directed otherwise, will be voted FOR the election of each of the nominees. Abstentions and brokernon-votes will have no effect on the results of the vote. The Board of Directors recommends that shareholders vote“FOR” the election
of each of the nominees named above.
| | | | | 20 | | | Notice of Annual Meeting of Shareholders and 2018 Proxy Statement |
| | |
each of the nominees named above.
| | Proposal No. 1 – Election of Directors
|
Continuing Directors
Class II Directors | | | | | | | | | | 
| | | |  | | Wayland R. Hicks Age:76 78 Director Since:2009 | | Company Board Committees: • Lead Director; Compensation; Nominating and& Corporate Governance Qualifications and Skills to
Serve as a Director:
| | Other Public Company Directorships: • United Rentals, Inc. (1998-2009) | | | | | | Qualifications and Skills to Serve as a Director: • Former Chief Executive Officer of public companies • Expertise in operations, general manufacturing, international business, mergers and acquisitions, logistics, executive compensation, and strategic planning and analysis | | | | | | | | | | • Public company board and committee experience |
Mr. Hicksserved as Director and Vice Chairman of United Rentals, Inc., a construction equipment rental company, from 1998 until March 2009. At United Rentals, Inc., he also served as Chief Executive Officer from December 2003 until June 2007 and Chief Operating Officer from 1997 until December 2003. Mr. Hicks served as Chief Executive Officer and President of Indigo N.V., a manufacturer of commercial and industrial printers, from 1996 to 1997, and as Vice Chairman and Chief Executive Officer of Nextel Communications Corp. from 1994 to 1995. From 1967 to 1994, he held various executive positions with Xerox Corporation. Mr. Hicks also served as a Director of Perdue Farms Inc. from 1991 to 2014. Mr. Hicks holds a B.A. degree in Economics from Indiana University. | | | | Notice of Annual Meeting of Shareholders and 2021 Proxy Statement | | | 25 |
| | |
| | Proposal No. 1 – Election of Directors |
| | | | | | | | | | 
| | | |  | | Judith A. Johansen Age:6063 Director Since:2006 | | Company Board Committees: • Compensation, Chair; Nominating & Corporate Governance Nominating
Other Public Company Directorships: • IDACORP and Idaho Power Company, Member of Compensation and Corporate Governance & Nominating Committees Qualifications and Skills to Serve as a Director: | | Other Public Company
Directorships:
• IDACORP and Idaho Power
Company, Member of Compensation and Corporate Governance & Nominating Committees
| | | | | | • Former Chief Executive Officer of a public reporting company • Expertise in operations, general manufacturing, international business, mergers and acquisitions, logistics, executive compensation, and strategic planning and analysis • Public company board and committee experience | | | | | | | | | | |
Ms. Johansenserved as President of Marylhurst University in Lake Oswego, Oregon, a position she held from July 2008 to September 1, 2013. From December 2001 through March 2006, Ms. Johansen was President and Chief Executive Officer of PacifiCorp, an electric utility, and was their Executive Vice President of Regulation and External Affairs from December 2000 to December 2001. She was Administrator and Chief Executive Officer of the Bonneville Power Administrator, a regional Federal power marketing agency, from 1998 to 2000. Ms. Johansen earned her B.A. in Political Science from Colorado State University and her J.D. from Northwestern School of Law at Lewis & Clark College. | | | | | | | Notice of Annual Meeting of Shareholders and 2018 Proxy Statement | | | | 21 | |
| | |

| | Proposal No. 1 – Election of Directors
|
| | | | | | | | | | | | | |  | | Tamara L. Lundgren Age:6164 Director Since:2008 | | Company Board Committees: • None (Ms. Lundgren is the Company’s CEO)Board Chairman Other Public Company Directorships: • Ryder System, Inc., Member of Audit and Corporate Governance & Nominating Committees Qualifications and Skills to Serve as a Director: | | Other Public Company
Directorships:
• Ryder System, Inc.,
Member of Audit and Corporate Governance & Nominating Committees
| | | | | | | • Chief Executive Officer of Schnitzer Steel Industries, Inc. • Expertise in commodities, strategic planning and analysis, finance, operations, change management, international business, government and community relations, mergers and acquisitions, and investment banking • Public company board and committee experience | | | | | | | | | | | |
Ms. Lundgrenhas served as President, Chief Executive Officer and a Director of the Company since December 2008.2008 and as Chairman of the Board since March 2020. Ms. Lundgren joined the Company in September 2005 as Vice President and Chief Strategy Officer, and held positions of increasing responsibility including President of Shared Services and Executive Vice President and Chief Operating Officer. Prior to joining the Company, Ms. Lundgren was a managing director in investment banking at JPMorgan Chase, which she joined in 2001. From 1996 until 2001, Ms. Lundgren was a managing director of Deutsche Bank AG in New York and London. Prior to joining Deutsche Bank, Ms. Lundgren was a partner at the law firm of Hogan Lovells (formerly Hogan & Hartson, LLP) in Washington, D.C. Ms. Lundgren also currently serves as a DirectorDeputy Chair of the Board of Directors of the Federal Reserve Bank of San Francisco. She earned her B.A. from Wellesley College and her J.D. from the Northwestern University School of Law. Class III Directors
| | | | | | | | | | | | | |  | | John D. Carter
Age:72
Director Since:2005
| | Company Board Committees:
• Board Chairman
Qualifications and Skills to
Serve as a Director:
| | Other Public Company
Directorships:
•Northwest Natural Gas Company, Member of Governance and Finance Committee and Chair of Audit Committee
•FLIR Systems, Inc., Chair of Corporate Governance Committee
| | | | | | • Former Chief Executive Officer of Schnitzer Steel Industries, Inc.
• Extensive international business experience
• Expertise in strategic planning and analysis, mergers and acquisitions, operations, environmental affairs, and government relations
• Public company board and committee leadership experience
| | | | | | | | | | |
Mr. Carter has been Chairman of the Board since December 2008 and was President and Chief Executive Officer of the Company from May 2005 to December 2008. From 2002 to May 2005, Mr. Carter was engaged in a consulting practice focused primarily on strategic planning in transportation and energy for national and international businesses, while also owning other small business ventures. From 1982 to 2002, Mr. Carter served in a variety of senior management
capacities at Bechtel Group, Inc., an engineering and construction company, including as Executive Vice President and Director, as well as President of Bechtel Enterprises, Inc., a wholly-owned subsidiary, and other operating groups. He retired from Bechtel at the end of 2002. Prior to his Bechtel tenure, Mr. Carter was a partner in a San Francisco law firm. He is a graduate of Stanford University and Harvard Law School.
| | | | | 22 | | | Notice of Annual Meeting of Shareholders and 20182021 Proxy Statement | | | 26 |
| | |
| | Proposal No. 1 – Election of Directors |
Class III Directors | | | | | | | | | | | | | |  | | Michael W. Sutherlin
Age:72
Director Since:2015
| | Glenda J. Minor Age: 65 Director Since: 2020 | | Company Board Committees: • Audit; Nominating and Corporate Governance Other Public Company Directorships: Compensation;• Curtiss-Wright Corporation, Member of the Audit Committee and the Committee on Directors and Governance
• Albermarle Corporation, Member of the Audit & Finance and Nominating & Governance Committees Qualifications and Skills to Serve as a Director: • Former Chief Financial Officer of a leading steel manufacturer • In-depth understanding of the preparation and analysis of financial statements, experience in financial reporting and internal controls • Experience in capital market transactions, investor relations, mergers and acquisitions, and international business • Public company board and committee experience |
Ms. Minor has served as Chief Executive Officer and Principal of Silket Advisory Services, a privately owned consulting firm, since 2016. Silket Advisory Services advises companies on financial, strategic, and operational initiatives. From 2010 until 2015, Ms. Minor was Senior Vice President and Chief Financial Officer of EVRAZ North America Limited, a leading steel manufacturer. Prior to this, Ms. Minor held both domestic and international executive finance roles at increasing levels of managerial responsibility at Visteon Corporation and DaimlerChrysler, as well as financial management roles at General Motors Corporation and General Dynamics Corporation. Ms. Minor holds a Bachelor’s degree in Accounting from Southern University in Baton Rouge, Louisiana and an MBA in International Business from Michigan State University. | | | | | 
| | Michael W. Sutherlin Age: 75 Director Since: 2015 | | Company Board Committees: • Compensation; Nominating and Corporate Governance Other Public Company Directorships: • Peabody Energy Corporation, Member of the Compensation Committee and Chair of the Nominating CommitteeAudit Committees | | | | | | Qualifications and Skills to Serve as a Director: • Experience as public company Chief Executive Officer and public company Board Chairman • Manufacturing and mining sector experience • Core operations, executive leadership, international business, and executive compensation experience | | | | | | | | | | • Public company board and committee experience |
Mr. Sutherlinserved as President and Chief Executive Officer and Director of Joy Global, Inc., a manufacturer and servicer of mining equipment for the extraction of coal and other minerals and ores, from 2006 until 2013. He was Executive Vice President, President and Chief Operating Officer of Joy Mining Machinery from 2003 to 2006. Prior to that time, Mr. Sutherlin held positions of increasing responsibility for Varco International, Inc., including President and Chief Operating Officer and Division President. Mr. Sutherlin holds a Bachelor of Business Administration from the Texas Tech University and an MBA from the University of Texas at Austin. | | | | Notice of Annual Meeting of Shareholders and 2021 Proxy Statement | | | 27 |
| | |
| | Proposal No. 1 – Election of Directors |
Corporate Governance The Company is committed to strong corporate governance. The Company is governed by a Board of Directors and Committees of the Board that meet throughout the year. Directors discharge their responsibilities at Board and Committee meetings and also through other communications with management. Our Board of Directors has an Audit Committee, a Compensation Committee, and a Nominating and Corporate Governance Committee (the “N&CG Committee”), each of which has a written charter adopted by the Board of Directors, copies of which are posted on our website at www.schnitzersteel.com.www.schnitzersteel.com. The Board of Directors has also adopted Corporate Governance Guidelines which are posted on our website. Under our Corporate Governance Guidelines, committee members are appointed annually and the chairs of, and director membership on, committees are periodically rotated based on the skills, desires, and experiences of the members of the Board. Director Independence The Board of Directors has determined that Wayland R. Hicks, Rhonda D. Hunter, David L. Jahnke, Judith A. Johansen, William D. Larsson, Glenda J. Minor, and Michael W. Sutherlin are “independent directors” as defined by our Corporate Governance Guidelines, SEC rules, and NASDAQ listing requirements. Accordingly, a majority of the directors have been determined to be independent directors. The independent directors regularly meet in executive sessions at which only independent directors are present. The independent directors serve on the following committees: | | | | | | | | | | | | | | Board Committees | Director
| | Audit
| | Compensation
| | Nominating
& Corporate
Governance
| Wayland R. Hicks
| | | | l | | l | Rhonda D. Hunter
| | l | | | | l | David L. Jahnke
| | C | | l | | | Judith A. Johansen
| | | | C | | l | William D. Larsson
| | l | | | | C | Michael W. Sutherlin
| | l | | l | | |
l = Member C = Chair
| | | | | | Director | | Audit | | Compensation | | Nominating & Corporate Governance | | | Wayland R. Hicks | | | | • | | • | | | Notice of Annual Meeting of Shareholders and 2018 Proxy Statement | Rhonda D. Hunter | | • | | • | | | | | David L. Jahnke | | C | | • | | | | | Judith A. Johansen | | | | C | | • | | | William D. Larsson | | • | | | | C | | | Glenda J. Minor | | • | | | | • | | | Michael W. Sutherlin | | | 23 | |
| | |
| | Proposal No. 1 – Election of Directors•
|
•= Member C = Chair During fiscal 2018,2021, the Board of Directors held foureight meetings, the Audit Committee held eight meetings, the Compensation Committee held sixfive meetings, and the N&CG Committee held four meetings. Each director attended at least 75% of the aggregate number of meetings of the Board and committees of the Board on which he or she served that were held during the period for which he or she served. We encourage all directors to attend each annual meeting of shareholders. All directors then serving attended the 20182021 annual meeting. Board Leadership The currentBoard periodically assesses its leadership structure in light of the Company’s needs and circumstances. The Board leadership structure separatescurrently combines the role of Chairman and CEO. These roles have been separateCEO and has an independent lead director since May 2005,the Chairman and CEO is a non-independent director. At this time, the Board and the N&CG Committee have determinedbelieves that the current structure continuesCEO, as a Company executive, is in the best position to be appropriate as it enablesfulfill the CEOChairman’s responsibilities, including those related to focus onidentifying emerging issues facing the complexitiesCompany, communicating essential information to the Board about the Company’s performance and challengesstrategies, and proposing agendas for the Board. As detailed in her biography, Ms. Lundgren has over 16 years of experience with the Company, during which time she has held a number of senior executive leadership positions. We believe her in-depth knowledge of the role asCompany and her extensive executive and management experience make her uniquely well-positioned to lead the Board in developing and monitoring the strategic direction of the Company. We believe that our chief executive officer while enablingBoard leadership structure is enhanced by the Chairman to provideindependent leadership at the Board level.provided by our independent lead director. This leadership structure also enables the Board to better fulfill its risk oversight responsibilities, as described under “The Board’s Role in Risk Oversight.”
The Board periodically assesses its leadership structure in light of the Company’s needs and circumstances. The Board also has a lead director, who is an independent director. Under our Corporate Governance Guidelines, the lead director role is periodically rotated among the independent directors.directors, and the role is currently held by Mr. Hicks. The lead director’s responsibilities include: facilitating effective communication between the Board and management; consulting with the Chairman and the CEO;Chairman; and presiding at meetings of the Board when the Chairman is not present, including executive sessions of the independent directors. The lead director generally attends all meetings of the Board’s committees.
| | | | Notice of Annual Meeting of Shareholders and 2021 Proxy Statement | | | 28 |
| | |
| | Proposal No. 1 – Election of Directors |
Board Committees and Responsibilities Audit Committee Chair:David L. Jahnke Additional Members:Rhonda D. Hunter, William D. Larsson, and Michael W. SutherlinGlenda J. Minor Meetings Held in 2018:2021: Eight Independence:Our Board has determined that each member of the Audit Committee meets all additional independence requirements for Audit Committee members under applicable SEC regulations and NASDAQ rules. Audit Committee Financial Literacy and Expertise:Our Board also has determined that each member of the Audit Committee is financially literate under applicable SEC and NASDAQ rules and is an “audit committee financial expert” as defined in regulations adopted by the SEC. The Audit Committee represents and assists the Board in oversight of our accounting and financial reporting processes and the audits of our financial statements; appointing, approving the compensation of, and overseeing the independent auditors; reviewing and approving all audit andnon-audit services performed by the independent auditors; reviewing the scope and discussing the results of the audit with the independent auditors; reviewing management’s assessment of the Company’s internal controls over financial reporting; overseeing the Company’s compliance program; overseeing the Company’s internal audit function; reviewing with management the Company’s major financial risks and legal risks that could have a significant impact on the Company’s financial statements; and reviewing and approving, as appropriate, all transactions of the Company with related persons (see “Certain Transactions”). Compensation Committee Chair:Judith A. Johansen Additional Members:Wayland R. Hicks, David L. Jahnke, Rhonda D. Hunter, and Michael W. Sutherlin Meetings Held in 2018: Six2021: Five Independence:Our Board has determined that each member of the Compensation Committee meets the additional independence standards for Compensation Committee members under the NASDAQ rules and qualifies as anon-employee and outside director under Rule16b-3 under the Securities Exchange Act of 1934 and under section 162(m) of the Internal Revenue Code, respectively. | | | | | 24 | | | Notice of Annual Meeting of Shareholders and 2018 Proxy Statement |
| | |
| | 1934. Proposal No. 1 – Election of Directors
|
Compensation Committee Interlocks and Insider Participation:No members of the Compensation Committee who served during 20182021 were officers or employees of the Company or any of its subsidiaries during the year, were formerly Company officers, or had any relationship otherwise requiring disclosure as a compensation committee interlock. The Compensation Committee has overall responsibility for the administration of the Company’s executive and director compensation plans and equity-based plans; overseeing and evaluating the performance of the CEO and determining the CEO’s compensation; administering and interpreting executive compensation plans, the Company’s stock plans, and all other equity-based plans from time to time adopted by the Company, including our 1993 Amended and Restated Stock Incentive Plan (“SIP”); reviewing and assessing the risks related to the design of the Company’s compensation programs and arrangements determining the compensation of the other executive officers; in consultation with the N&CG Committee, reviewing and recommending to the Board for approval compensation for members of the Board, including compensation paid to the Chairman, Lead Director and committee chairs; and overseeing the preparation of executive compensation disclosures included in the Company’s proxy statement in accordance with the SEC rules and regulations. For a description of the Compensation Committee’s activities regarding executive compensation, refer to the “Compensation Discussion and Analysis.” | | | | Notice of Annual Meeting of Shareholders and 2021 Proxy Statement | | | 29 |
| | |
| | Proposal No. 1 – Election of Directors |
Nominating and Corporate Governance (“N&CG”) Committee Chair:William D. Larsson Additional Members:Wayland R. Hicks, Rhonda D. Hunter, and Judith A. Johansen, Glenda J. Minor, and Michael W. Sutherlin Meetings Held in 2018:2021: Four Independence:Our Board has determined that each member of the N&CG Committee is independent under applicable SEC regulations and NASDAQ rules. The N&CG Committee has responsibility for identifying, selecting, and recommending to the Board individuals proposed to be (i) nominated for election as directors by the shareholders or (ii) elected as directors by the Board to fill vacancies; working with the Chairman of the Board and the Lead Director, seeking to ensure that the Board’s committee structure, committee assignments, and committee chair assignments are appropriate and effective; developing and recommending to the Board for approval, and reviewing from time to time, a set of corporate governance guidelines for the Company, which includes a process for the evaluation of the Board, its committees, and management; reviewing and evaluating risks related to corporate governance practices and leadership succession; developing and maintaining director education opportunities; and monitoring compliance with the corporate governance guidelines adopted by the Board. Assessment of Director Qualifications: The N&CG Committee uses a Board composition matrix to inventory, on at least an annual basis, the expertise, skills, and experience of each director to ensure that the overall Board maintains a balance of knowledge and relevant experience. The Committee carefully reviews all director candidates, including current directors, based on the current and anticipated composition of the Board, our current and anticipated strategy and operating requirements, and the long-term interests of shareholders. In assessing current directors and potential candidates, the N&CG Committee considers the Board composition matrix, as well as the character, background, and professional experience of each current director and potential candidate. In its evaluation of potential candidates, the N&CG Committee applies the criteria set forth in our Corporate Governance GuidelinesN&CG Committee Charter and considers the following factors:factors from our Corporate Governance Guidelines: Qualification as an “independent director”Directors should be of the highest ethical character, exhibiting integrity, honesty, and accountability, with a willingness to express independent thought; Character, integrity, soundSuccessful leadership experience and stature in an individual’s primary field, with a background that demonstrates an understanding of business judgment,affairs and diversitythe complexities of viewpoints and experiencea large, publicly-held company, with particular emphasis on capital-intensive, global businesses; AccomplishmentsDemonstrated ability to think strategically and make decisions with a forward-looking focus, with the ability to assimilate relevant information on a broad range of complex topics; Reputation in the business communityIndependence and absence of conflicts of interest; Knowledge of our industry or other relevant industriesDemonstrated ability to work together and with management collaboratively and constructively; Financial expertise or other specific skillsTime available and willingness to devote the time necessary to effectively fulfill their duties as directors; InquisitiveAn awareness of the social, political, regulatory, and objective perspectiveeconomic environment in which the Company operates; and CommitmentDiversity of experience and availability to conduct Board responsibilitiesbackground. In considering there-nomination of incumbent directors, the N&CG Committee also takes into account the performance of such persons as directors, including the number of meetings attended and the level and quality of participation, as well as the value of continuity and knowledge of the Company gained through Board service. | | | | | | | Notice of Annual Meeting of Shareholders and 2018 Proxy Statement | | | | 25 | |
| | |
| | Proposal No. 1 – Election of Directors
|
Diversity: The N&CG Committee strives to achieve diversity on the Board by considering skills, experience, education, length of service on the Board, and such other factors as it deems appropriate. The N&CG Committee and the Board define diversity broadly to include the background, professional experience, skills, and viewpoints necessary to achieve a balance and mix of perspectives. In evaluating potential director candidates, the N&CG Committee and the Board place particular emphasis on diversity. Confirming our commitment to diversity at the Board level, our director candidate search process ensures that women and minorities are included in the initial pool of candidates when we select new director nominees (aka “the Rooney Rule”). Our Board recognizes the value of diversity and considers how a candidate may contribute to the Board in a way that can enhance perspective and judgment through diversity in gender, age, ethnic background, geographic origin, and professional experience. | | | | Notice of Annual Meeting of Shareholders and 2021 Proxy Statement | | | 30 |
| | |
| | Proposal No. 1 – Election of Directors |
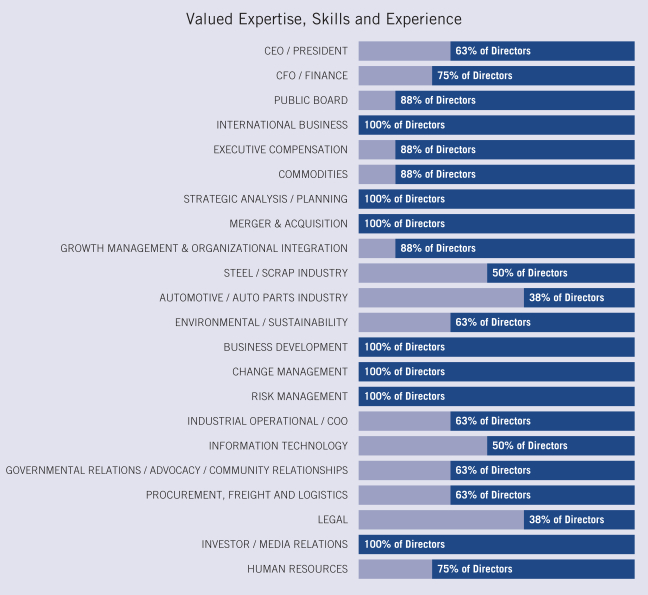
Valued Expertise, Skills and Experience CEO / President 63% of Directors CFO / Finance 75% of Directors Public Board 88% of Directors International Business 100% of Directors Executive Compensation 88% of Directors Commodities 88% of Directors Strategic Analysis / Planning 100% of Directors Merger & Acquisition 100% of Directors Growth Management & Organizational Integration 88% of Directors Steel / Scrap Industry 50% of Directors Automotive / Auto Parts Industry 38% of Directors Environmental / Sustainability 63% of Directors Business Development 100% of Directors Change Management 100% of Directors Risk Management 100% of Directors Industrial Operational / COO 63% of Directors Information Technology 50% of Directors Governmental Relations / Advocacy / Community Relationships 63% of Directors Procurement, Freight and Logistics 63% of Directors Legal 38% of Directors Investor / Media Relations 100% of Directors Human Resources 75% of DirectorsBOARD SKILLS AND EXPERIENCE
| | | | | | | 
| | Industry & Operations Experience We seek directors with management, operational, and regulatory experience in the industries in which we compete. These attributes tend to give directors specific insight into, and expertise that will foster active participation in, the development and implementation of our operating and business strategy. | | 
| | Global Experience We seek directors with global business experience because selling our ferrous and nonferrous products to customers around the world is a significant aspect of our business. | 
| | Investor Experience To promote strong alignment with our investors, we seek directors who have experience overseeing capital investments and investment decisions. We believe that these directors can help focus management and the Board on the most critical value drivers for the Company, including with respect to setting executive compensation targets and objectives. | | 
| | Risk Management Experience In light of the Board’s role in overseeing risk management and understanding the most significant risks facing the Company, we seek directors with experience in risk management and oversight. | 
| | Finance & Accounting Experience We use a broad set of financial metrics to measure performance, and accurate financial reporting and robust auditing are critical to our success. We have a number of directors who qualify as audit committee financial experts, and we expect all of our directors to have an understanding of finance and financial reporting processes. | | 
| | Environmental & Sustainability Experience We seek directors with environmental, sustainability, and regulatory experience as we remain steadfast in our focus on safety, sustainability, and integrity as tenets of our Company’s core strategy to deliver growth and profitability. |
| | | | Notice of Annual Meeting of Shareholders and 2021 Proxy Statement | | | 31 |
| | |
| | Proposal No. 1 – Election of Directors |
Board Self-Assessments The Board conducts an annual self-evaluationsself-evaluation to determine whether it and its committees are functioning effectively and whether its governing documents continue to remain appropriate. Our Board’s self-evaluation is facilitated by a wide range of questions related to topics including operations, composition of the Board, Board diversity, responsibilities, governing documents, and resources. As part of the Board self-evaluation process, each director also conducts an evaluation of the Chairman of the Board and the Lead Director. The process is designed and overseen by the N&CG Committee, and the results of the evaluations are discussed by the full Board. Each committee annually reviews its own performance and assesses the adequacy of its charter and | | | | | 26 | | | Notice of Annual Meeting of Shareholders and 2018 Proxy Statement |
| | |
| | Proposal No. 1 – Election of Directors
|
reports the results and any recommendations to the Board. The N&CG Committee oversees and reports annually to the Board its assessment of each committee’s performance evaluation process. The N&CG Committee coordinates its oversight of the Board self-assessment process with its process for assessment of individual director qualifications. Director Nominations The N&CG Committee identifies potential director candidates through a variety of means, including recommendations from members of the Board, suggestions from Company management, and shareholder recommendations. The N&CG Committee also may, in its discretion, engage director search firms to identify candidates. Shareholders may recommend director candidates for consideration by the N&CG Committee by submitting a written recommendation to Schnitzer Steel Industries, Inc., Attn: Chair of the Nominating & Corporate Governance Committee, c/o Corporate Secretary, 299 SW Clay Street, Suite 350, Portland, Oregon 97201. The recommendation should include the candidate’s name, age, qualifications (including principal occupation and employment history), and written consent to be named as a nominee in our proxy statement and to serve as a director, if elected. All recommendations for nomination received by the Corporate Secretary that satisfy our bylaw requirements relating to such director nominations will be presented to the N&CG Committee for its consideration. The N&CG Committee meets to discuss and consider the qualifications of each potential new director candidate, whether recommended by shareholders or identified by other means, and determines by majority vote whether to recommend such candidate to the Board of Directors. The final decision to either elect a candidate to fill a vacancy between annual meetings or include a candidate on the slate of nominees proposed at an annual meeting is made by the Board of Directors. In considering the current directors, including the director nominees proposed for election at the Annual Meeting, the N&CG Committee and the Board specifically considered the background, experiences, and qualifications described in their biographies appearing under “Proposal 1—Election of Directors” in this proxy statement. Director Tenure We do not have a fixed retirement age for directors. Under our Corporate Governance Guidelines, a director (other than the Chief Executive Officer) is requirednot expected to submitstand for re-election after he or she has served as a written resignationdirector for fifteen years although the Nominating and Corporate Governance Committee may recommend to the Board tothat, based on specific circumstances, the director’s tenure should be effective atextended beyond the endexpiration of the director’s then current term when the director beginsduring which he or she reached his or her 15thfifteenth year of service on the Board. The Board may accept or reject the tendered resignation after considering the recommendation of the N&CG Committee as to the appropriateness of the director’s continued membership on the Board.service. The Board’s Role in Risk Oversight We have a comprehensive enterprise risk management process in which management is responsible for managing the Company’s risks and the Board and its committees provide oversight of these efforts. Our Senior Vice President, Chief Financial Officer & Chief of Corporate Operations reports to our CEO,management-level Enterprise Risk Committee is responsible for the risk management program, and provides periodic reports to the Board.Board at least quarterly and more frequently as circumstances require. Risks are identified, assessed, and managed on an ongoing basis and communicated to management during management meetings or otherwise as appropriate. Existing and potential material risks are reviewed during periodic executive management and/or Board meetings, resulting in Board and/or Board committee discussion and public disclosure, as appropriate. The Board is responsible for overseeing management in the execution of its risk management responsibilities and for assessing the Company’s approach to risk management. The Board administers this risk oversight function either through the full Board or through its standing committees. | | | | | The following are the key risk oversight responsibilities of our Board and its committees: •◾ Full Board: enterprise-wide strategic risks related to our long-term strategies, including capital expenditures, Sustainability, ESG, cybersecurity, and material acquisitions
•◾ Audit Committee: financial risks (including risks associated with accounting, financial reporting, disclosure, and internal controls over
financial reporting), our compliance programs, and legal risks
•◾ Compensation Committee: risks related to the design of the Company’s compensation programs and arrangements
•◾ N&CG Committee: risks related to corporate governance practices and leadership succession
|
| | | | Notice of Annual Meeting of Shareholders and 2021 Proxy Statement | | | 32 |
| | |
| | Proposal No. 1 – Election of Directors |
Assessment of Compensation Risk Management andThe Compensation Committee, with the assistance of Pearl Meyer, the Compensation Committee conducted an assessment ofCommittee’s independent compensation consultant, assessed the risks associated with our compensation programs and determined that they do not create risks which are reasonably likely to have a material adverse impact on us. In conducting the evaluation, the Compensation Committee with the assistance of Pearl Meyer, its independent compensation consultant, reviewed our compensation structure and
noted numerous ways in which risk is effectively managed or mitigated, including: Balance of corporate and business unit weighting in incentive plans Mix between short-term and long-term incentives Use of multiple performance measures | | | | | | | Notice of Annual Meeting of Shareholders and 2018 Proxy Statement | | | | 27 | |
| | |
| | Proposal No. 1 – Election of Directors
|
A portfolio of varied long-term incentives Committee discretion in payment of short-term incentives Use of stock ownership guidelines Anti-hedging and anti-pledging policies and prohibition on derivative transactions for Company stock In addition, the Compensation Committee analyzed the overall enterprise risks and how compensation programs could impact individual behavior that could exacerbate these enterprise risks. In light of these analyses, the Compensation Committee believes that the architecture of our compensation programs (executive and broad-based) provide multiple, effective safeguards to protect against undue risk. | | | | Notice of Annual Meeting of Shareholders and 2021 Proxy Statement | | | 33 |
| | |
| | Proposal No. 1 – Election of Directors |
Board Oversight of Sustainability and ESG The Board of Directors view Sustainability and ESG as a core elements of the Company’s strategy and operations. As such, the Board has oversight responsibility and is regularly briefed on progress with respect to Sustainability and ESG goals, including issues relating to human capital and climate. 
For more information about our sustainability and ESG efforts, please visit our sustainability microsite at https://sustainability.schnitzersteel.com/. | | | | Notice of Annual Meeting of Shareholders and 2021 Proxy Statement | | | 34 |
| | |
| | Proposal No. 1 – Election of Directors |
Board Oversight of Management Succession Planning Our Board and management consider succession planning and leadership development to be an integral part of the Company’s long-term strategy. At least annually, our full Board reviews senior management succession and development plans with our CEO. Our CEO presents to the full Board her evaluations and recommendations of future candidates for key leadership roles, including for the CEO position, and potential succession timing for those positions, including under emergency circumstances. Following the CEO’s presentation, the Board meets in executive session without our CEO to consider and discuss CEO succession. The Board also reviews and discusses development plans for individuals identified as high-potential candidates for key leadership positions, and the Board members interact with these candidates in formal and informal settings during the year. Prohibition on Hedging, Pledging and Derivative Trading Our stock trading policy, applicable to our directors and employees, prohibits hedging, pledging, and derivative trading in our Company’s stock. Specifically, our stock trading policy prohibits engaging in any short sale of our stock, establishing or using a margin account with a broker-dealer for the purpose of buying or selling our stock or using it as collateral therefor, or buying or selling puts, calls, prepaid variable forward contracts, equity swaps, collars, exchange funds, or other instruments or derivatives designed to hedge the value of our stock. Our Commitment to Sustainable Business Practices
As one of our core values, sustainable business practices set the foundation for our longevity and continued success. We view sustainability as integrated into our business, a key component of our long-term strategy, and essential to our future growth and success.
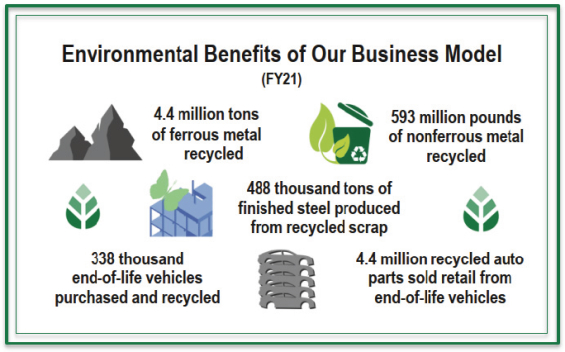
We are one of North America’s largest recyclers of scrap metal, a leading provider of used and recycled auto parts, and a manufacturer of finished steel products from recycled metal. The very essence of our business model is predicated on recycling - a cornerstone for sustainability. Our automotive and metals recycling facilities process scrap metals for reuse by steel mills globally, and our steel mill produces finished products from recycled metals, conserving natural resources and significantly reducing greenhouse gas emissions.
To increase the transparency of our sustainable business practices with our various stakeholders, we publish an annual Sustainability Report which focuses on:
In November 2018, we released our fifth annual Sustainability Report which covered fiscal 2017 and 2018 and continued to show year-over-year reductions in our carbon emissions, energy consumption, water usage, and process waste generation on a normalized(per-unit) basis. We are committed to operating our business in a safe, efficient, and environmentally responsible manner.
Key Performance Indicators (KPIs) we report on are aligned with internationally recognized standards and have been assured by independent analysis for materiality and accuracy. In order for us to further develop our sustainability strategy and identify levers and approaches to improve our sustainability performance, we appointed a Vice President, Chief Sustainability Officer as a direct report to the CEO in fiscal 2017.
In 2018, for the fourth year in a row, Schnitzer was named a World’s Most Ethical Company by the Ethisphere Institute, a global leader in defining and advancing the standards of ethical business practices. We also, again, earned the Ethics Inside© Certification and Anti-Bribery Program Verification, endorsements of our Company’s commitment to ethical business practices.
Additional information on our commitment to sustainable business practices is included in the Proxy Summary at page 3.
Please also visit:
http://www.schnitzersteel.com/sustainability_report.aspx to view our latest the Sustainability Report, which presents our KPIs and profiles the best practices we employ to ensure the sustainability of our business and the communities in which we operate.
| | | | | 28 | | | Notice of Annual Meeting of Shareholders and 2018 Proxy Statement |
| | |
| | Proposal No. 1 – Election of Directors
|
Communication with Directors Shareholders and other interested parties may communicate with any of the directors, including our lead independent director, by using the following address: Board of Directors Schnitzer Steel Industries, Inc. 299 SW Clay Street, Suite 350 Portland, OR 97201 The office of the Corporate Secretary reviews correspondence received and will filter advertisements, solicitations, spam, and other such items not related to a director’s duties and responsibilities. All other relevant correspondence addressed to a director will be forwarded to that director, or if none is specified, to the Chairman of the Board. | | | | Notice of Annual Meeting of Shareholders and 2021 Proxy Statement | | | 35 |
| | |
| | Proposal No. 1 – Election of Directors |
Non-Employee Director Compensation Our non-employee directors receive cash compensation as well as equity compensation in the form of DSUsDeferred Stock Units (DSUs) for their Board service. Compensation forour non-employee directors is set by the Board at the recommendation of the Compensation Committee. Guiding Principles Fairly compensate directors for their responsibilities and time commitments. Attract and retain highly qualified directors by offering a compensation program consistent with those at companies of similar size, scope, and complexity. Align the interests of directors with our shareholders by providing a significant portion of compensation in equity and setting an expectation pursuant to theour Corporate Governance Guidelines that directors acquire and continue to own our common stock with a value equal to five times the director’s annual cash retainer. Provide compensation that is simple and transparent Directors are expected to shareholders.achieve this stock ownership level within a period of five years.
Review Process The Compensation Committee, which consists solely of independent directors, periodically assesses the form and amountof non-employee director compensation and recommends changes, if appropriate, to the Board based upon competitive market practices. The Compensation Committee’s independent compensation consultant also supports the Compensation Committee in determining director compensation and designing the related benefit programs. As part of its periodic review, the Compensation Committee conducts extensive benchmarking by reviewing director compensation data for the executive compensation peer group described in “Competitive Market Overview” on page 38.45. | | | | Notice of Annual Meeting of Shareholders and 2021 Proxy Statement | | | 36 |
| | |
| | Proposal No. 1 – Election of Directors |
Annual Compensation The following table sets forth certain information concerning compensation paid to directors other than Ms. Lundgren, our CEO, during the fiscal year ended August 31, 2018 (unless otherwise noted in the footnotes to the table).2021. | | | | | | | | | | | | | | | | | | | | | Name | | Fees Earned or Paid in Cash ($)(1) | | | Stock Awards ($)(2) | | | Change in Pension Value and Nonqualified Deferred Compensation Earnings ($) | | | All Other Compensation ($) | | | Total ($) | | David J. Anderson(4) | | | 29,361 | | | | — | | | | — | | | | — | | | | 29,361 | | John D. Carter | | | 300,000 | | | | — | | | | — | (3) | | | — | | | | 300,000 | | Wayland R. Hicks | | | 105,000 | | | | 119,993 | | | | — | | | | — | | | | 224,993 | | Rhonda D. Hunter | | | 65,421 | | | | 119,993 | | | | — | | | | — | | | | 185,414 | | David L. Jahnke | | | 92,547 | | | | 119,993 | | | | — | | | | — | | | | 212,540 | | Judith A. Johansen | | | 92,547 | | | | 119,993 | | | | — | | | | — | | | | 212,540 | | William D. Larsson | | | 85,805 | | | | 119,993 | | | | — | | | | — | | | | 205,798 | | Michael W. Sutherlin | | | 75,805 | | | | 119,993 | | | | — | | | | — | | | | 195,798 | |
| | | | | | | Notice of Annual Meeting of Shareholders and 2018 Proxy Statement | | | | 29 | |
| | |
| | Proposal No. 1 – Election of Directors
|
| | | | | | | | | | | | | | | | | | | | | | | | | | | Name | | Fees Earned or Paid in Cash ($)(1) | | Stock Awards ($)(2) | | Change in Pension Value and Nonqualified Deferred Compensation
Earnings ($)(3) | | Total ($) | John D. Carter(4) | | | | 122,500 | | | | | — | | | | | (26,491) | | | | | 96,009 | | Wayland R. Hicks | | | | 105,000 | | | | | 119,980 | | | | | 3,221 | | | | | 228,201 | | Rhonda D. Hunter | | | | 90,000 | | | | | 119,980 | | | | | — | | | | | 209,980 | | David L. Jahnke | | | | 115,000 | | | | | 119,980 | | | | | 15,631 | | | | | 250,611 | | Judith A. Johansen | | | | 108,000 | | | | | 119,980 | | | | | — | | | | | 227,980 | | William D. Larsson | | | | 100,000 | | | | | 119,980 | | | | | 8,515 | | | | | 228,495 | | Glenda J. Minor | | | | 72,940 | | | | | 145,757 | | | | �� | — | | | | | 218,697 | | Michael W. Sutherlin | | | | 90,000 | | | | | 119,980 | | | | | — | | | | | 209,980 | |
| (1) | Fees earned includes amounts deferred at the election of a director under the Deferred Compensation Plan forNon-Employee Directors, which is described below. |
| (2) | Represents the aggregate grant date fair value of awards computed in accordance with Financial Accounting Standards Board (“FASB”) Accounting Standards Classification (“ASC”) Topic 718. These amounts reflect the grant date fair value and may not correspond to the actual value that will be realized by the directors. Stock awards consist of DSUs valued using the closing market price of the Company’s Class A common stock on the NASDAQ Global Select Market on the grant date. On January 30, 2018,26, 2021, the date of the Company’s 20182021 annual meeting, each director then in office other than Mr. Carter and Ms. Lundgren was granted DSUs for 3,4584,006 shares. The grant date fair value of this DSU grant to each director was $119,993$119,980 (or $34.70$29.95 per share) which was equal to the closing market price of the Company’s Class A common stock on the grant date. These DSUs vest on January 28, 201924, 2022 (the day before the 20192022 Annual Meeting), subject to continued Board service. The amount for Ms. Minor also includes a grant of 1,158 DSUs on November 9, 2020 in connection with her appointment to the Board. The grant date fair value of this DSU grant to Ms. Minor was $25,777 (or $22.26 per share) which was equal to the closing market price of the Company’s Class A common stock on the grant date. The DSUs become fully vested on the earlier death or disability of a director or a change in control of the Company (as defined in the DSU award agreement). After the DSUs have become vested, directors will be credited with additional whole or fractional shares to reflect dividends that would have been paid on the stock underlying the DSUs subsequent to the grant date. The Company will issue Class A common stock to a director for the vested DSUs in a lump sum in January of the year following the year the director ceases to be a director of the Company, subject to the right of the director to elect an installment payment program under the Company’s Deferred Compensation Plan forNon-Employee Directors. |
| At August 31, 2018, allnon-employee directors, excluding Mr. Carter, held 3,458At August 31, 2021, all non-employee directors, excluding Mr. Carter, held 4,006 shares of unvested DSUs.
|
| (3) | RepresentsWith respect to Mr. Carter, the amount represents a decrease of $21,067$26,491 in the actuarial present value of Mr. Carter’s accumulated benefits under the Company’s Pension Retirement Plan and the Company’s Supplemental Executive Retirement Bonus Plan. At August 31, 2018,2021, the actuarial present value of Mr. Carter’s accumulated benefits under these plans was $404,130.$429,479. During fiscal 2018,2021, Mr. Carter received distributions of $26,141 under the Supplemental Executive Retirement Bonus Plan and distributions of $9,071 under the Pension Retirement Plan. With respect to Messrs. Hicks, Jahnke and Larsson, the directors who have elected to defer a portion of their director cash fees in accordance with the Company’s non-qualified deferred compensation plan for non-employee directors, the amounts represent the amount of interest earned on the amounts deferred that exceeds the amount of interest calculated using 120% of the applicable federal long-term rate.
|
| (4) | Mr. Anderson ceased to be a director onCarter retired from the Board effective January 30, 2018,26, 2021, the date of the Company’s 20182021 annual meeting. |
Fiscal 2021 director fees did not increase as compared to fiscal 2020. The annual fee fornon-employee directors is $80,000$90,000 ($105,000 for the Lead Director). We do not pay fees for attendance at Board and committee meetings. The annual cash retainer for the Chairs of the Audit, Compensation, and CompensationN&CG Committees is $25,000, $18,000 and for the Chair of the N&CG Committee is $10,000.$10,000, respectively. The Lead Director and Committee Chairs receive additional compensation due to the increased workload and additional responsibilities associated with these positions. In 2004, directors began participating in the Company’s SIP, and in 2004 and 2005non-employee directors received stock option grants. Since August 2006,non-employee directors have been awarded DSUs instead of stock options. One DSU gives the director the right to receive one share of Class A common stock at a future date (as described in footnote 2 above). At each annual meeting of shareholders, eachnon-employee director receives DSUs for a number of shares equal to $120,000 divided by the closing market price of the Class A common stock on the grant date.
Pursuant One DSU gives the director the right to the Corporate Governance Guidelines, directors are expected to make significant progress annually toward accumulating, within five yearsreceive one share of becomingClass A common stock at a director, common shares of the Company with a value equal to five times the director’s annual cash retainer.future date (as described in footnote 2 above).
Non-employee directors may elect to defer all or part of their compensation under the Deferred Compensation Plan forNon-Employee Directors, which was adopted by the Board in 2006. Directors’ cash fees are credited to a cash account or a stock account, as selected by the director. Payments from the cash account are paid in cash, and payments from the stock account are paid in Class A common stock. TheIn accordance with the plan, the cash account is credited with quarterly interest equal to the average interest rate paid by us under our senior revolving credit agreement (or (or if there are no borrowings in a quarter, at the prime rate) plus two percent. The stock account is credited with additional whole or partial shares reflecting dividends that would have been paid on the shares. Deferred amounts are paid in a single payment or in equal annual installment payments for up to 15 years commencing in January following the date the director ceases to be a director. DSUs are credited to the directors’ stock accounts under the plan when the DSUs become vested, and the awards are administered under the plan. A director may elect to receive stock under a DSU in equal annual installment payments for up to 15 years commencing in January following the date the director ceases to be a director.
| | | | Notice of Annual Meeting of Shareholders and 2021 Proxy Statement | | | 37 |
| | |
| | Proposal No. 1 – Election of Directors |
Mr. Carter served as the Company’s CEO from May 2005 until December 2008, when he was succeeded in that position by our current CEO, Ms. Lundgren. At that time, Mr. Carter entered into an amended and restated employment agreement with the Company to serve as our Chairman of the Board, which agreement has beenwas further amended. Under the current agreement, Mr. Carter receivesreceived an annual fee of $300,000, payable quarterly in arrears, for service asnon-employee Chairman isEmeritus, was ineligible for other compensation paid tonon-employee directors, and receivesreceived continuation of health insurance benefits. The agreement with Mr. Carter currently continuesexpired upon the conclusion of the term of his service as Chairman throughEmeritus on the date of the Company’s annual meeting of shareholders in 2021. We have entered into indemnity agreements with each director pursuant to which we agree to indemnify such director in connection with any claims or proceedings involving the director by reason of serving as a director of the Company, as provided in the agreement. | | | | | 30 | | | Notice of Annual Meeting of Shareholders and 20182021 Proxy Statement | | | 38 |
Compensation Discussion and Analysis Overview This Compensation Discussion and Analysis provides a detailed description of our executive compensation philosophy and programs, the decisions that the Compensation Committee (the “Committee”) of the Board of Directors (the “Board”) have made under those programs, and the factors considered in those decisions. This Compensation Discussion and Analysis focuses on the compensation of our NEOs for fiscal 20182021 disclosed in the tables under the “Compensation of Executive Officers” section of this proxy statement. The NEOs for fiscal 20182021 are listed below. | | | Name | | Title | Tamara L. Lundgren Name
| | Title | Tamara L. Lundgren | | Chairman, President and Chief Executive Officer (“CEO”) | Richard D. Peach | | SeniorExecutive Vice President, Chief Financial Officer and& Chief of Corporate OperationsStrategy Officer (“CFO”)
| Michael R. Henderson | | Senior Vice President and President, Operations | Steven G. Heiskell | | Senior Vice President andCo-President, Auto and Metals Recycling and Cascade Steel and Scrap President, Products & Services | Steven G. Heiskell
Peter B. Saba | | Senior Vice President, andCo-President, AutoGeneral Counsel and Metals Recycling | Jeffrey Dyck
| | Senior Vice President andCo-President, Cascade Steel and Scrap
Corporate Secretary |
Consideration of 2018Shareholder Outreach and Say-on-Pay Advisory Vote and Shareholder OutreachResults
The Compensation Committee seeks to align the Company’s executive compensation program with the interests of the Company’s shareholders. On an annual basis the compensation of our NEOs, as disclosed in our annual proxy statement, is submitted to our shareholders for anon-binding advisory vote(“Say-on-Pay”). At our 20182021 annual meeting, approximately 65%75% of the votes cast were in favor of the advisory resolution to approve our executive compensation program. This level of support was a significant decline from the 2017 and 2016Say-on-Pay votes, when 96% of the votes cast were in favor of this proposal in each year. In order to gain a better understanding of any shareholder concerns and to identify areas for improvement within our executive compensation programs, we began a formal annual investor outreach process fourseven years ago topro-actively reach out to our investors. Since 2015, we have had discussions, either by phone or in person, with shareholders representing more than half of our outstanding shares.ago. These discussions have involved boththe Chair of the Board, our Lead Independent Director, and the Chair of the Compensation Committee, and either the Chairmanas appropriate. As part of the Board of Directors or our Lead Independent Director. During 2018,annual outreach efforts, wepro-actively proactively reached out to investors holding approximatelytwo-thirds of our outstanding shares, and had discussionsengaging with investors holding nearly 15% of outstanding shares. Prior to our 2018 annual meeting, the proxy advisory firm, Institutional Shareholder Services (“ISS”), issued a negative vote recommendation in connection with ourSay-on-Pay proposal. As a basis for its recommendation, ISS cited that while the Company had not materially extended nor amended the CEO’schange-in-control agreement, the Company should have removed the legacy excise taxgross-up
provision from thechange-in-control agreement when the Company amended the CEO’s employment agreement in connection with a $100,000 increase in base salary in July 2017. This 10% salary increase was the first increase in the CEO’s base salary in over six years, reflecting the adverse market conditions during that period. Because the CEO’s employment agreement provides for annual review and periodic increase of the CEO’s base salary, the Company did not consider this to be a material amendment. While none of the investors we had discussions with in 2018 indicated that the excise taxgross-up issue resulted in a vote against ourSay-on-Pay proposal, we are mindful of the ISS position and are committed to the Company’s policy in place since 2008 that such excise taxgross-up provisions will not be included in any new or modifiedchange-in-control agreements going forward.
Continuing a trend that began two years ago, this year there was a limited number of investors requesting a meeting which we attribute primarily to the Company’s continued strong performance and satisfaction with the changes made in response to the shareholder input received in recent years, including the significant changes made to our executive compensation program beginning in fiscal 2016 and the improved readability and transparencyrepresenting approximately 30% of our proxy statement beginning with the proxy for fiscal 2015.
outstanding shares in response. Discussions with investors and shareholderSay-on-Pay voting are key drivers in our compensation design to continue alignment between our compensation programs and the interests of shareholders. | | | | | | | Notice of Annual Meeting of Shareholders and 20182021 Proxy Statement | | | | 31 | 39 |
| | |
| | Compensation Discussion and Analysis |
Summary of Actions Taken in Response to Shareholder Feedback | | | | | The Company values investor feedback and will continue to seek feedback through engagement initiatives to align our executive compensation programs with shareholder expectations. Shareholder feedback has influenced a number of changes to our executive compensation program in recent years, including: | | ✓ We revised the annual incentive plan to include an EBITDA metric, and we increased overall weighting towards financial performance metrics. ✓ We restructured the annual incentive plan safety metric to encompass environmental, health, and safety (EH&S) performance. | Actions taken in 2016 and 2017:
| | | ✓ | | We revamped the proxy statement to provide greater clarity regarding our compensation philosophy, the link between short-termshort- term and long-term pay and value creation, and how the compensation plans fit within the Company’s long-term strategy. | | | ✓ | | We revised our compensation peer group to better reflect companies with similar quantitative and qualitative characteristics. | | | ✓ | | We revised the selection of our performance peer group using a quantitative and qualitative approach similar to that used for selecting the compensation peer group, while also reflecting companies in our industry which are viewed as traditional peers but may not be appropriate (e.g., too large) for purposes of comparing compensation. | | | ✓ | | The Committee We restructured the Company’s long-term performance share plan to use metrics which we believe provide better alignment with the experience of shareholders.
| | | ✓ | | The Committee We increased the performance period for performance share awards to three years.
| | | ✓ | | We revised the proxy descriptions to provide a better understanding of the link between productivity and cost reduction initiatives and long-term value creation. | | | ✓
| | The Committee cappednon-income statement metrics in annual incentive plans at 1.0x if adjusted earnings per share were below threshold and at 0.5x if adjusted earnings per share arewere negative.
| | | Actions taken in 2018:
| | | | ✓ | | We enhanced the proxy statement disclosure of our long-term incentive performance metrics, including disclosure of why we have chosen specific metrics, and their alignment with shareholder interests, and disclosure of additional information on how the target levels were determined. | | | ✓ | | We included a “positive TSR” modifier in our performance share awards whereby if our TSR is negative when measured over the full performance period, the maximum TSR payout factor is limited to 1.0x even if the relative TSR would have resulted in a greater payout factor. ✓We instituted a clawback policy regarding recovery of incentive compensation. | | |
Based on shareholder feedback and to provideyear-to-year consistency and an opportunity to assess the changes made in fiscal 2016 and 2017, the Compensation Committee determined to maintain the basic design of the executive compensation program in fiscal 2018. In addition, the Compensation Committee took the following actions for fiscal 2018:
| ✓ | Replaced cash flow return on investment (CFROI) with ROCE as We removed accelerated vesting upon retirement and included a financial metrictwo-year service requirement and continued vesting feature in our RSU awards for performance shares granted in fiscal 2018 to better align the Company’s long-term goals with the interests of shareholders
|
✓ | No increase in CEO base salary and increases in base salary for all other NEOs ranged from 3.3% to 5.1%
|
✓ | Correlated our bonus modifier targets with our publicly stated long-term volume and margin growth targets
|
Shareholder Engagement Cycle
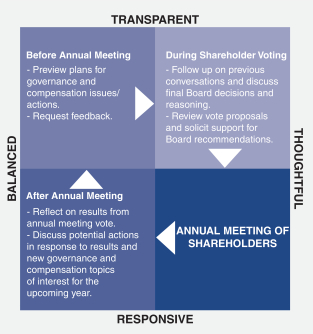
| | | | | 32 | | | Notice of Annual Meeting of Shareholders and 2018 Proxy Statement |
| | |
| | Compensation Discussion and Analysis
|
| During 2018, the shareholders with whom we had discussions expressed their support for our Board, governance program, and engagement efforts. In addition, they also commended our responsiveness to shareholder concerns with respect to changes we have made to our executive compensation programs in recent years.
retirement-eligible employees. |
How Executive Pay is Linked to Company Performance Our executive compensation program is aligned with our business strategy and with creating long-term shareholder value by paying for performance consistent with what our Compensation Committee views as an acceptable risk profile. The foundation of our compensation philosophy is to: Promote creation of long-term shareholder value; Recruit and retain qualified, high performing executive officers; Motivate high levels of performance; and Be competitive in the market for talent. Our executive compensation program emphasizes delivering compensation at a competitive market level which will allow executive officers who demonstrate consistenton-target performance over a multi-year period to earn compensation that is competitive and consistent with targeted performance levels of total compensation. When performance is above target over the long term, we believe the program will reward executives above the competitive median. Conversely, the program will provide less than the annual target compensation when performance does not meet expectations. Individual executive compensation may be above or below the annual target level, based on the Company’s performance; economic and market conditions; the individual’s performance, contribution to the organization, experience, expertise, and skills; and other relevant factors. | | | | | Initiatives: Delivering Operational and Economic Benefits to Increase Long-Term Shareholder Value
| | | Initiative
| | Fiscal 2018 Results
| | | Increase volumes
| | • Delivered higher ferrous and nonferrous volumes through a combination of expanding supply channels and further diversifying sales, supported by positive market conditions
• Ferrous volume target of 4.3 million tons achieved in fiscal 2018, one year ahead of the initial fiscal 2019 target
| | | Expand operating margins
| | • AMR expanded operating margins through ferrous and nonferrous volume growth and the benefits from a continued focus on productivity and commercial initiatives, supported by positive market conditions
• CSS significantly expanded its operating margins as a result of benefits from productivity improvements and higher steel prices
| | | Generate operating cash flow
| | • Generated $160 million in operating cash flow through increased profitability and working capital management, enabling us to continue to invest in the Company, reduce debt by 26%, and return capital to our shareholders through our quarterly dividend and share repurchases
| | | Optimize operating platform
| | • Continued to increase the efficiency of our processes in order to produce a quality product for customers on a cost-effective basis and to recover higher nonferrous volumes from the shredding process; and invested in additional processing technologies to increase throughput, lower processing costs, increase recovery rates, and create products with the metallic content sought by customers
| | |
| | | | | | | Notice of Annual Meeting of Shareholders and 20182021 Proxy Statement | | | | 33 | 40 |
| | |
| | Compensation Discussion and Analysis |
Summary of our Executive Compensation Program Set forth below is a summary of our executive compensation practices. We seek and carefully consider shareholder feedback regarding our compensation practices We link our executive compensation to our performance | | – | | More than 80% of the target compensation for the CEO and approximately 70% of the target compensation for the NEOs other than the CEO are“at-risk.” |
| | – | | We select metrics in our short-term annual incentive plans that are expected to drive long-term shareholder value and metrics in our long-term incentive plan that are intended to reflect creation of shareholder value. |
| | – | | For the CEO, the fiscal 20182021 Annual Performance Bonus Program (“APBP”) metrics were linked to earnings before interest, taxes, depreciation and amortization (“EBITDA”), earnings per share (“EPS”), safety performance, productivity improvements, operating cash flow, strategic objectives, and strategic objectives.environmental, health and safety (“EH&S”) performance. |
| | – | | For NEOs other than the CEO, the fiscal 20182021 Annual Incentive Compensation Plan (“AICP”) metrics were linked to EBITDA, EPS, safety performance, productivity improvements, and operating cash flow.flow, and EH&S performance. |
| | – | | For NEOs, including the CEO, thenon-income statement metrics in the annual incentive plans (i.e., safetyEH&S performance productivity improvements, and operating cash flow) would be capped at 0.5x if adjusted EPS were cappednegative and at 1.0x if adjusted EPS were below threshold (0.25x) in fiscal 2018 at 0.5x in the event adjusted earnings per share were negative.2021. |
| | – | | 50% of the long-term equity awards are performance share awards that vest following the end of a three-year performance period based on Company performance during the period. For performance share awards granted in fiscal 2018,2021, the metrics are based 50% on relative TSR and 50% on ROCE. |
| | – | | 50% of the long-term equity awards are time-vested RSUs which vest ratably over a five-year time period and are intended to incentivize executives to create shareholder value through stock price appreciation, and provide a retention incentive.appreciation. |
– For fiscal 2018, the annual incentive plans for the CEO and other NEOs included a bonus modifier based on corporate performance measures and target goals that were designed to drive profitable growth and achieve strategic objectives. The targets for the bonus modifier were intended to be “stretch” goals that could not be easily achieved.
| | – | | Metrics and targets for incentive plans are based on the Company’s strategic and business plans and |
| annual budgets that are reviewed by the full Board and are analyzed and tested for reasonableness before Committee approval at the beginning of the performance period. The Committee actively evaluates the appropriateness of the financial measures used in incentive plans and the degree of difficulty in achieving specific performance targets. |
Peer group appropriateness | | – | | Beginning with fiscal 2016, the process for selecting the Company’s compensation peer group was changed to identify a mix of companies which the Committee believes provides a more comparable aggregate benchmark. Quantitative and qualitative criteria were applied to better reflect current market capitalization and revenue parameters and to expand the qualitative assessment of potential compensation peers to focus on position in the value chain and exposure to international markets. |
| | – | | OurFor fiscal 2021, our benchmarking compensation peer group includes 13included 14 companies that the Committee believes reflectbelieved reflected appropriate industry, size, geographic scope, and market dynamics.
|
No reloading,re-pricing, or backdating of stock options
Stock ownership and retention requirements | | – | | We have adopted stock ownership guidelines to promote long-term alignment of the interests of our shareholders and our officers, as discussed on page 51.56. |
| | – | | Once officers achieve compliance, they must also retain at least 50% of shares that vest thereafter for at least three years. |
Double-trigger for cash severance payments and benefits inchange-in-control agreements | | – | | Ourchange-in-control agreements are double trigger, i.e., a change in control plus termination of the executive’s employment by the successor company without cause or by the executive for good reason isare required to trigger cash severance payments and benefits. |
| | – | | No excise taxgross-ups in any new or modifiedchange-in-control agreements going forward.agreements. |
| | – | | We use a mix of annual and long-term incentive awards and overlapping performance periods to drive current performance in light of long-term objectives. |
| | | | | 34 – | | | Notice of Annual Meeting of Shareholders and 2018 Proxy Statement |
| | |
| | Compensation Discussion and Analysis
|
| – | The complementary and diverse performance metrics across our plans are designed to drive balanced decision-making, consistent with our model of shareholder value creation. |
| | | | Notice of Annual Meeting of Shareholders and 2021 Proxy Statement | | | 41 |
| | |
| | Compensation Discussion and Analysis |
| – | | Annual incentive plans have been modified to cap or limit payments when earnings results fallare negative or below threshold levels.threshold. |
| – | | We include a “positive TSR” modifier in our performance share awards whereby if our TSR is negative when measured over the full performance period, the maximum TSR payout factor is limited to 1.0x even if the relative TSR would have resulted in a greater payout factor. |
| – | | Committee reserves discretion in payment of short-term incentives. |
| | – | | Perquisites totaled less than $70,000$50,000 in fiscal 20182021 for the CEO and less than $11,000$0 for each other NEO. |
Independent compensation consultant | | – | | The Committee directly retains Pearl Meyer as its compensation consultant. Pearl Meyer does not provide any other services to the Company. |
Clawback policy to recapture incentive awardscompensation | | – | | We have adopted a clawback policy with respect to recapture incentive awards that requires that such awards be repaid to the Companycompensation in the event of certain acts of fraud or misconduct that result in the material restatement of the Company’s financial results. |
Fiscal 2018 Business Performance
Fiscal 2021 Business Performance Safest Year in Company’s History. Our recordable incident rate in fiscal 2021 was the lowest recorded in our Company’s history, driven by our team’s commitment to safety training, hazard awareness, and continuous improvement. 93% of our facilities did not experience a lost time injury in fiscal 2021. Achieved 100% Net Carbon-free Electricity Use. We achieved our goal of 100% net carbon-free electricity use in fiscal 2021—a year ahead of schedule. Best Operating Performance in a Decade.In fiscal 2018,2021, we delivered our strongest financial resultsbest operating performance in the past seven years with both divisions producinga decade, underpinned by a combination of strong results. We almost tripled our consolidated operating income on a year-over-year basis. We also generated 19% higher total ferrous volumes, 9% higher total nonferrous volumes, and 5% higher finished steel volumes year-over-year. Our strong results reflect theglobal market conditions for recycled metals, productivity benefits from our multi-year strategic initiatives, including the transition to grow volumesour “One Schnitzer” operating platform, and expand margins, supported by positive market conditionsdecarbonization trends, including the increased demand for recycled metals. Despite challenges from the COVID-19 pandemic, logistics constraints, and alabor shortages, we continued focus on productivity. As shownto broaden our supply flows and diversify our sales base, leading to year-over-year growth in the graphs below, we delivered significant improvements in our business performance in fiscal 2018. Our fiscal 2018 reported earnings per share of $5.46, which includes discrete tax benefits of $1.58 per share, represents a substantial increase compared to fiscal 2017 reported earnings per share of $1.60. Our return on capital employed also grew significantly in fiscal 2018. Even excluding discrete tax benefits, we achieved a return on capital employed of over 15%, demonstrating the successful execution of our growth and capital investment strategy.
In our Auto and Metals Recycling business, we exportedboth our ferrous and nonferrous products to 25 countries, demonstrating the flexibility of our operating platform. Insales volumes.
Our results were impacted by a fire in May 2021 at our Cascade Steelsteel mill. There were no injuries to personnel, and Scrap business, operating income increased more than six times year-over-year,property loss and damage were limited to the mill’s melt shop. Following substantial completion of the replacement and repair of property and equipment lost or damaged due to the fire, we continued our multi-year strategy to enhance product quality, increase productivity,began ramping up production at the steel mill in mid-August, several months ahead of schedule. As a result of the production outage, finished steel sales volumes decreased year over year. Generated $190 million of Operating Cash Flow. Our profitability and investstrong working capital to enhance our operations. Our strong operating income performance in fiscal 2018management enabled us to delivergenerate operating cash flow of $160$190 million and reducein fiscal 2021. We reduced our debt by 26%to its lowest level since fiscal 2005, while continuing to invest in our Companykey strategic initiatives to deliver growth and return capital to our shareholders through our quarterly dividend paymentspayments. We have paid a dividend every quarter since becoming a public company in 1993.
Progressed Implementation of $21 millionAdvanced Metal Recovery Technologies. We continued to progress the implementation of our advanced metal recovery technology systems, including the ramp-up of production at new systems we installed in California and share repurchasesGeorgia. The new technologies encompass advanced copper separation, advanced aluminum separation, and primary nonferrous recovery. In fiscal 2021, we commissioned five new systems. We expect to complete the commissioning of $17 million or almost 2%the remaining eight systems in fiscal 2022. Our objective of total outstanding shares.extracting more nonferrous metals from our shredding activities is a significant value-added process and is directly aligned with global decarbonization, environmental impact, and demand trends. Increased Ferrous and Nonferrous Sales Volumes. Our focus on commercial initiatives to broaden supply flows and further diversify our sales base enabled us to increase our ferrous and nonferrous sales volumes in fiscal 2021 by 11% and 8%, respectively, compared to the prior fiscal year. Additionally, we made significant progress on our objective to increase sales volumes with the acquisition of eight metals recycling facilities in the southeastern U.S., a region expected to see a significant increase in electric arc furnace steelmaking capacity in the coming years. The transaction closed in early fiscal 2022. Pay Commensurate with Performance. Finally, our strong operating performance has translated into strong financial and stock price performance for the period ending fiscal 2021, helping us to continue delivering pay commensurate with performance. 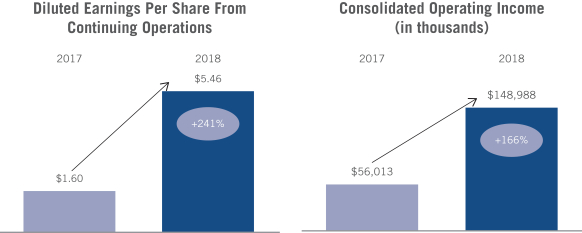
| | | | | | | Notice of Annual Meeting of Shareholders and 20182021 Proxy Statement | | | | 35 | 42 |
| | |
| | Compensation Discussion and Analysis
|
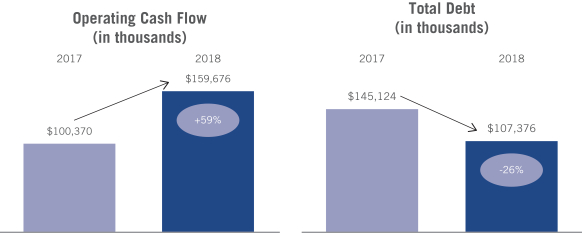
In addition to the significant improvements in operating performance as shown in the charts above, the following is a summary of our fiscal 2018 accomplishments. Additional detail can be found in our Annual Report on Form10-K.
| | | | | | | Fiscal 2018 Accomplishments
| | | | | Strongest operating performance since 2011 | | | | | • Reported earnings per share of $5.46, which includes discrete tax benefits of $1.58 per share, represents a substantial increase compared to fiscal 2017 reported earnings per share of $1.60
| | | | | Expanded operating margins
| | | | | • AMR expanded operating margins through ferrous and nonferrous volume growth and the benefits from a continued focus on productivity and commercial initiatives, supported by positive market conditions
• CSS significantly expanded its operating margins as a result of benefits from productivity improvements and higher steel prices
| | | | | Volume growth
| | | | | • Achieved 19% higher total ferrous volumes and 9% higher total nonferrous volumes through a combination of expanding supply channels, further diversifying sales, and improved market conditions
| | | | | Continued to strengthen operating platform and improve productivity
| | | | | • Increased sales volumes by building on the agility and flexibility of our sales distribution platform, our strong customer relationships, and the quality of our products
| | | | | Generated $160 million of operating cash flow
| | | | | • Reduced debt by 26% to its lowest level in the past eight years
| | | | | • Returned capital to shareholders through dividend payments of $21 million and share repurchases of $17 million or almost 2% of total outstanding shares
| | | | |
Our fiscal 2018 compensation program links pay to performance. As a result of this linkage of pay to performance, actual compensation in fiscal 2018 was higher than target levels reflecting alignment with the Company’s strong financial performance as represented by the following:
The overall APBP performance multiple for the CEO was 2.60x and the overall AICP performance multiple for the other NEOs was 1.66x.
For fiscal 2018, the annual incentive plans for the CEO and other NEOs included a bonus modifier based on performance measures and target goals that were designed
| | to drive profitable growth and achieve strategic objectives. As a result of our reaching these goals in fiscal 2018, a modifier of 7.5% was applied to and is included in the CEO’s APBP payout multiple and a modifier of 15% was applied to and is included in the other NEOs’ AICP payout multiple, in each case as set forth above.
|
The performance shares that vested for the fiscal 2016-2018 performance period paid out at an aggregate average of 1.48x of target for the CEO and other NEOs.
No increase in CEO base salary and increases in base salary for all other NEOs ranged from 3.3% to 5.1%.
| | | | | 36 | | | Notice of Annual Meeting of Shareholders and 2018 Proxy Statement |
| | |
| | Compensation Discussion and Analysis |
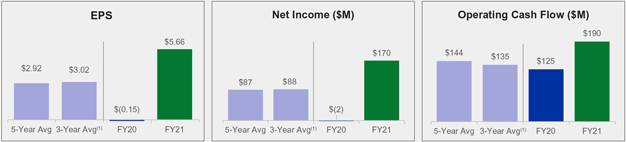
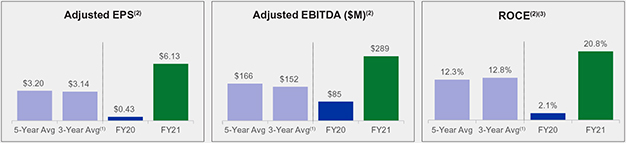
| | (1) | 3-year average represents pre-COVID years of FY17, FY18, and FY19 | |
| (2) | Adjusted EPS and adjusted EBITDA are non-GAAP financial measures. ROCE includes in its calculation adjusted net income which is also a non-GAAP financial measure. These non-GAAP financial measures should be considered in addition to, but not as a substitute for, the information provided in accordance with U.S. generally accepted accounting principles (“GAAP”). A reconciliation to the most directly comparable GAAP financial measures is provided in Appendix A to this Proxy Statement. | |
| (3) | ROCE is equal to adjusted net income from continuing operations attributable to the Company, excluding interest expense (net of tax), divided by average capital (average of the last day of the fiscal year and the four preceding fiscal quarters of the Company’s consolidated total assets less consolidated total liabilities other than debt and capital lease obligations). | |
Our fiscal 2021 compensation program links pay to performance. Our fiscal 2021 results represent the best operating performance in a decade, including the highest EPS since fiscal 2008. We strengthened our core operations through productivity initiatives, progressed strategic investments in advanced metal recovery technologies and increased our sales volumes. Our profitability led to strong operating cash flow, which enabled us to reduce our debt to the lowest level since 2005, while continuing to return capital to shareholders and invest in our strategic initiatives to deliver growth. Fiscal 2021 was also the safest year recorded in our Company’s 116-year history. As a result of our performance, the overall Annual Performance Bonus Program (“APBP”) performance multiple for the CEO was 2.79x and the overall Annual Incentive Compensation Plan (“AICP”) performance multiple for the other NEOs was 1.88x. The Executive Compensation Process Role of the Compensation Committee.Committee.The Committee is responsible for: Developing and making recommendations to the Board with respect to our compensation policies and programs; Determining the levels of all compensation to be paid to the CEO and other NEOs (including annual base salary and incentive compensation, equity incentives, and benefit plans); and Administering and granting stock options, performance shares, RSUs, and other awards under our 1993 Amended and Restated Stock Incentive Plan (“SIP”). The Committee cannot delegate this authority. The Committee regularly reports its activities to the Board. The Committee comprises fourfive directors, each of whom has been determined by the Board to be independent under our Corporate Governance Guidelines, applicable SEC and NASDAQ rules, and IRS regulations. Currently, the members of the Committee are Judith A. Johansen, Chair, Wayland R. Hicks, Rhonda D. Hunter, David L. Jahnke, and Michael W. Sutherlin. The Committee operates pursuant to a written charter (available on the Company’s website athttp: https://www.schnitzersteel.com/documents/compensation-committee-charter-jul-2016.pdf)compensation-committee-charter.pdf) which is reviewed by the Committee on an annual basis and approved by the Board. The Committee meets at least quarterly and more frequently as circumstances require, including in executive session with the Committee’s independent compensation consultant. In fiscal 2018,2021, the Committee held sixfive meetings. | | | | Notice of Annual Meeting of Shareholders and 2021 Proxy Statement | | | 43 |
| | |
| | Compensation Discussion and Analysis |
Use of Compensation Consultants.The Committee has authority to retain compensation consultants to assist it in the evaluation of executive officer and employee compensation and benefit programs. The Committee directly retained Pearl Meyer as its compensation consultant for fiscal 2018.2021. In fiscal 2018,2021, Pearl Meyer performed, among others, the following services for the Committee: Attended Committee meetings by telephone and in person as requested by the Committee and participated in executive sessions without management present; and Provided input and participated in discussions related to CEO annual and long-term incentive plan goal design and metrics and other NEO annual and long-term incentive plan design and metrics for fiscal 2018.2021. The Committee’s independent compensation consultant provides information and data to the Committee from its surveys, proprietary databases, and other sources, which the Committee utilizes along with information provided by management and obtained from other sources. In making its decisions, the Committee reviews such information and data provided to it by its independent compensation consultant and management and also draws on the knowledge and experience of its members as well as the expertise and information from within the Company, including from the human resources, legal, and finance groups. The Committee considers executive and director compensation matters at its quarterly meetings and at special meetings as needed based on our annual compensation schedule. Pearl Meyer and its affiliates did not perform any additional services for the Company or any of its affiliates in fiscal 2018.2021. The Committee has assessed the independence of Pearl Meyer pursuant to the applicable rules and determined that its engagement does not raise any conflict of interest. Separately, the Company retained Willis Towers Watson to provide management with performance data for the relative TSR calculation under the Company’s Long-Term Incentive Plan (“LTIP”) and to provide advice to management regardingestimate the CEO pay ratio calculation.grant date fair value of the LTIP performance share awards with a TSR metric. CEO’s Role in the Compensation-Setting ProcessProcess.. The CEO, with input from Pearl Meyer, makes recommendations to the Committee regarding compensation for the other NEOs. The CEO participates in Committee meetings at the Committee’s request to provide background information regarding our strategic objectives and to evaluate the performance of and make compensation recommendations for the other NEOs. The Committee utilizes the information provided by the CEO along with other information from within the Company, input from its independent compensation consultant, and the knowledge and experience of the Committee members in making compensation decisions. The Chair of the Committee recommends the CEO’s compensation to the Committee in executive session, not attended by the CEO. Annual EvaluationEvaluation.. The Committee annually evaluates the performance of the NEOs with the input from the CEO and, in executive session, evaluates the performance of the CEO and determines the annual incentive bonuses for all of the NEOs for the prior fiscal year. The Committee also approves the NEOs’ performance objectives for the current fiscal year, reviews and, if appropriate, adjusts their base salaries and annual incentive plan targets, and considers and approves LTIP grants. Performance ObjectivesObjectives.. The Committee approved performance objectives for fiscal 20182021 based, in part, on an active dialogue with the CEO regarding strategic objectives and performance targets. Metrics are tied to our strategic and business plans and to annual budgets reviewed by the full Board. Short-term management objectives, such as productivity improvements, are designed to achieve specific goals that are expected to drive long-term shareholder value. | | | | | | | Notice of Annual Meeting of Shareholders and 2018 Proxy Statement | | | | 37 | |
| | |
| | Compensation Discussion and Analysis
|
Metrics and targets are analyzed and tested for reasonableness prior to Committee approval at the beginning of the performance period. The Committee actively evaluates the appropriateness and rigor of the financial measures used in incentive plans and the degree of difficulty in achieving specific performance targets. As part of this evaluation, the Committee compares prior year metrics and results and also considers market and business conditions when the targets are established. The Committee believes that consideration of these factors is needed to ensure that targets are aligned with the desired degree of difficulty. The following flowchart provides an overview of the Committee’s process in setting performance goals. | | | | Notice of Annual Meeting of Shareholders and 2021 Proxy Statement | | | 44 |
| | |
| | Compensation Discussion and Analysis |
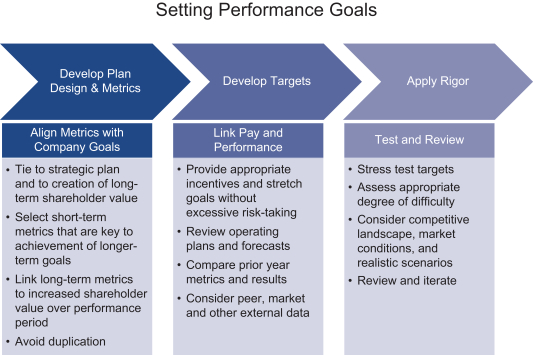
Setting Performance Goals Develop Plan Design & Metrics Align Metrics with Company Goals Tie to strategic plan and to creation of long-term shareholder value Select short-term metrics that are key to achievement of longer-term goals Link long-term metrics to increased shareholder value over performance period Avoid duplication Develop Targets Link Pay and Performance Provide appropriate incentives and stretch goals without excessive risk-taking Review operating plans and forecasts Compare prior year metrics and results Consider peer, market and other external data Apply Rigor Test and Review Stress test targets Assess appropriate degree of difficulty Consider competitive landscape, market conditions, and realistic scenarios Review and iterate 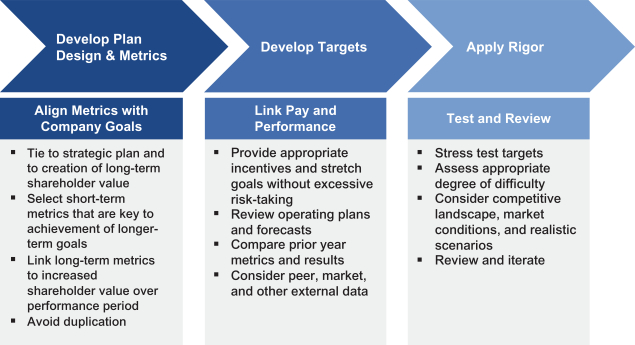
Competitive Market OverviewOverview.. While the Committee does not believe that it is appropriate to establish compensation levels based solely on benchmarking, it believes that information regarding pay practices at peer companies is useful in two respects. First, the Committee recognizes that our compensation practices must be competitive in order to recruit and retain talented executives, and reviewing market pay practices provides a framework for assessing competitiveness. Second, marketplace information is one of the many factors that the Committee considers in assessing the reasonableness of compensation. Although the Committee considers compensation levels for executive officers of other companies, it does not mechanically apply the data but rather engages in a rigorous quantitative and qualitative review and weighing of the competitive information with other Company and individual performance factors, such as our specific business strategy, financial situation, specific duties and responsibilities, and performance, in making its compensation determinations. There are few, if any, direct public market peers of an equivalent size. Accordingly, determining market comparisons requires a review of companies in auto and metals recycling and in steel manufacturing, as well as companies in the closely-related mining and raw materials businesses, and in broader industrial and financial markets from which we attract executive talent. In addition, as we interface with customers around the world, we seek specialized and top caliber executive officers from the broad national and international business executive pools. Proxy data from relevant companies, as well as input from both the Company’s and the Committee’s compensation consultants,consultant, are utilized. Total compensation is periodically compared to the competitive market in setting compensation for executive officers. Based on the feedback we received from our shareholder outreach following the 2015 annual meeting, the Committee elected to adjust its peer group for fiscal 2016 to reflect current market capitalization and revenue parameters and to expand the qualitative assessment of potential compensation peers to focus on position in the value chain and exposure to international markets. For example, a company that manufactures or whose products are used to make high-valueend-products would be less comparable to our business which buys, processes, and sells raw materials and produces intermediate-level products. As a result of our analysis, the
| | | | | 38 | | | Notice of Annual Meeting of Shareholders and 20182021 Proxy Statement | | | 45 |
| | |
| | Compensation Discussion and Analysis |
Committee made significant changes to our compensation peer group for fiscal 2016 to include a broader array of companies from similar industries, including steel manufacturing, metals recycling, coal and consumable fuels, diversified metals and mining, and aluminum, while still maintaining similar size market cap and revenue demographics. There were no changes to the compensation peer group in fiscal 2018 from fiscal 2017.
The Committee has established a separate performance peer group for purposes of the TSR metric in our fiscal 2018 three- year2021 three-year performance share awards. In developing the performance peer group, we used a quantitative and qualitative approach similar to that used for selecting the compensation peer group while adding companies viewed as traditional peers, who for reasons of size may not be appropriate for purposes of comparing compensation. There were no changes toWe removed one company from the performance peer group for fiscal 2021 as compared to fiscal 2020 because of its shift in industry focus following merger and acquisition activity and we removed one company from the fiscal 2018 from fiscal 2017.2021 performance and compensation peer groups after it was acquired by merger in March 2020. The following table shows the companies in the compensation and performance peer groups used in fiscal 2018:2021:
| | | | Market Capitalization (in $ millions)(1) | | Annual Revenue (in $ millions)(1) | | Fiscal 2018 Compensation Peer Group | | Fiscal 2018 Performance Peer Group | | A.K. Steel Holding Corp. | | | 1,401 | | | | 6,395 | | | X | | X | | | | | | Market Capitalization (in $ millions)(1) | | Annual Revenue (in $ millions)(1) | | Fiscal 2021 Compensation Peer Group | | Fiscal 2021 Performance Peer Group | | | Allegheny Technologies Inc. | | | 3,397 | | | | 3,768 | | | X | | X | | | 2,273 | | | | 2,565 | | | | X | | | | X | | | Arch Resources, Inc. | | | | 1,158 | | | | 1,551 | | | | X | | | Carpenter Technology Corporation | | | | 1,603 | | | | 1,476 | | | | X | | | Century Aluminum Co. | | | 1,106 | | | | 1,759 | | | X | | X | | | 1,155 | | | | 1,754 | | | | X | | | | X | | | Cleveland-Cliffs Inc. | | | 2,994 | | | | 2,253 | | | X | | X | | | 11,729 | | | | 12,996 | | | | X | | | | X | | | Cloud Peak Energy Inc. | | | 179 | | | | 885 | | | X | | | | Coeur Mining, Inc. | | | 1,063 | | | | 663 | | | X | | X | | | 1,812 | | | | 875 | | | | X | | | | X | | | Commercial Metals Co. | | | 2,528 | | | | 4,460 | | | X | | X | | | 3,934 | | | | 6,108 | | | | X | | | | X | | | Gerdau S.A. | | | 25,679 | | | | 12,020 | | | | | X | | | 8,955 | | | | 11,860 | | | | X | | | Ferroglobe PLC | | | 1,424 | | | | 2,064 | | | | | X | | Harsco Corporation | | | 2,284 | | | | 1,680 | | | X | | X | | Hecla Mining Co. | | | 1,355 | | | | 588 | | | X | | X | | | 3,302 | | | | 817 | | | | X | | | | X | | | Kaiser Aluminum Corporation | | | | 2,002 | | | | 1,593 | | | | X | | | Minerals Technologies Inc. | | | 2,371 | | | | 1,753 | | | X | | X | | | 2,642 | | | | 1,728 | | | | X | | | | X | | | Nucor Corporation | | | 19,771 | | | | 22,292 | | | | | X | | | 34,527 | | | | 25,994 | | | | X | | | Ryerson Holding Corporation | | | | 891 | | | | 4,251 | | | | X | | | Sims Metal Management Ltd. | | | 2,546 | | | | 4,905 | | | X | | X | | | 2,233 | | | | 4,348 | | | | X | | | | X | | | Steel Dynamics Inc. | | | 10,737 | | | | 10,474 | | | | | X | | | 13,776 | | | | 12,942 | | | | X | | | SunCoke Energy Inc. | | | 722 | | | | 1,416 | | | X | | X | | | 577 | | | | 1,337 | | | | X | | | | X | | | TimkenSteel Corp. | | | | 632 | | | | 1,018 | | | | X | | | United States Steel Corporation | | | 5,260 | | | | 13,139 | | | | | X | | | 7,226 | | | | 13,591 | | | | X | | | Westmoreland Coal Co.(2) | | | 3 | | | | 1,294 | | | X | | | | Schnitzer Steel Industries, Inc. | | | | 1,302 | | | | 2,378 | | |
| (1) | Market capitalization data is as of August 31, 20182021 and annual revenue data is as of the last 12 months ended August 31, 2018.2021. |
(2) | As a result of bankruptcy filings, this company was removed from the compensation peer group for fiscal 2019.
|
| | | | | | | Notice of Annual Meeting of Shareholders and 2018 Proxy Statement | | | | 39 | |
| | |
| | Compensation Discussion and Analysis
|
ElementsStructure of Compensation Program
Our executive compensation program consists of the items described below. | | | | | | | | | | | | | | Program(1) | | Purpose | | Relevant Performance Metrics | Annual | | Base Salary CEO: 18%
Other NEOs: 31%
| | To provide a competitive foundation and fixed rate of pay for the position and associated level of responsibility | | Not Applicable | | | Annual Performance Bonus Program (APBP) for CEO: 26%CEO | | To incentivize CEO achievement of annual operating, financial, and management goals | | EPS EPS (50%)
Safety PerformanceEBITDA
EH&S(2)(1) (10%)
Productivity Improvements (10%) Operating Cash Flow (10%) Strategic Objectives (20%)
AMR Operating Income and Sales Volumes(3) | | | Annual Incentive Compensation Plan (AICP) for other NEOs: 27%NEOs | | To incentivize achievement of annual operating, financial, and management goals | | EPS EPS (55%)
Safety Performance(2) (15%)EBITDA
Productivity Improvements (15%)
EH&S
Operating Cash Flow (15%) AMR Operating Income and Sales Volumes(3)
| Long Term
Long-Term | | Restricted Stock Units CEO: 28%
Other NEOs: 21%
| | To focus NEOs on long-term shareholder value creation and promote retention | | Absolute share price appreciation | | | | Performance Share Awards CEO: 28%
Other NEOs: 21%
| | To focus NEOs on achievement of financial goals and long-term shareholder value creation | | Relative Total Shareholder Return (TSR)(50%) Return on Capital Employed (ROCE) (50%) |
| (1) | Represents a percentage of total compensation.
|
(2) | Reflects Lost Time Incident Rate (“LTIR”);, Total Case Incident Rate (“TCIR”); and Layered Safety Observations (“LSO”).multiple environmental and safety performance activities. |
(3) | | | | Notice of Annual Meeting of Shareholders and 2021 Proxy Statement | | | 46 |
| | |
| | See “Components of Compensation–Bonus Modifier” described below.
Compensation Discussion and Analysis |
For performance shares awarded in fiscal 2018,2021, the performance period is three years, and the following metrics are utilized: Relative TSR against a peer group of companies with similar financial and operational characteristics (50% weighting); and ROCE against specific targets over the three-year performance period (50% weighting). Working with its independent compensation consultant, the Committee determined that TSR provides better alignment with the experience of shareholders and that ROCE, which measures how effectively we employ our capital over time, promotes efficient use of capital and long-term growth to create sustainable value for our shareholders. The Committee believes that our compensation programs provide an appropriate balance between: fixed andat-risk pay; and short-term and long-term incentives. While the Committee focuses on the total compensation opportunity for the NEO and not on a specific percentage of total compensation for any particular element, a substantial portion of the compensation opportunity beyond base salary isat-risk and must be earned based upon achievement of annual and long-term performance goals. The proportion of compensation designed to be delivered in base salary versus variable pay depends on the NEO’s position and the opportunity for that position to influence performance outcomes; the relative levels of compensation are based on differences in the levels and scope of responsibilities of the NEOs. Generally, the more senior the level of the NEO and the broader his or her responsibilities, the greater the amount of pay opportunity that is variable. | | | | | 40 | | | Notice of Annual Meeting of Shareholders and 2018 Proxy Statement |
| | |
| | Compensation Discussion and Analysis
|
The relationship between fixed and variable pay in our compensation program is illustrated by the following charts, which show (i) the relative portions of base salary, target annual incentive, and target value of equity awards that, in aggregate, comprised the fiscal 20182021 target total direct compensation of our CEO and of our other NEOs, and (ii) the relative portions of base salary, actual annual incentive, and grant date fair value of the equity awards that, in aggregate, comprised the fiscal 20182021 actual total direct compensation of our CEO and our other NEOs. Chief Executive Officer—Total Direct Compensation—Fiscal 2021 Named Executive Officers other than the CEO—Total Direct Compensation—Fiscal 2021 | | | | Notice of Annual Meeting of Shareholders and 2021 Proxy Statement | | | 47 |
| | | Chief Executive Officer – Total Direct Compensation – Fiscal 2018 | 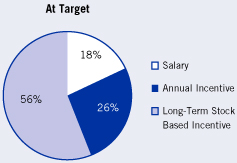
| | 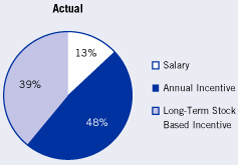
Compensation Discussion and Analysis |
| | | Named Executive Officers other than CEO – Total Direct Compensation – Fiscal 2018 | 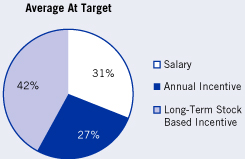
| | 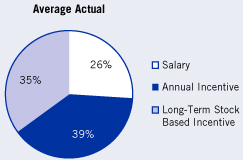
|
Components of Compensation Base SalarySalary.. Base salaries paid to NEOs are intended to attract and retain highly talented individuals. The Committee reviews the base salaries of our NEOs on an annual basis. Base salaries for NEOs are established on the basis of their individual performance and relevant business skills, scope of duties, and sustained contributions to our success, as well as competitive information as to similar positions in other relevant companies, taking into consideration relative company size and geographic location. The CEO’s base salary was unchanged in fiscal 2018. Effective November 2017,2020, the Committee approved salary adjustmentsincreases for the other NEOs ranging from 3.3% to 5.1%of 3%.
Annual Incentive ProgramsPrograms.. The Committee approves annual performance-based compensation under the CEO’s employment agreement and, for the other NEOs, under the AICP, as described below. A target bonus, expressed as a percentage of either base salary as of the end of the fiscal year or base salary paid during the fiscal year, is established for each NEO. The CEO’s target bonus percentage is specified under her employment agreement (see “Employment Agreements”). For other NEOs, the Committee annually reviews the target bonus percentages and approves any adjustments, which generally take effect immediately and apply on apro-rated prorated basis to bonuses payable for the current fiscal year. Bonus Modifier.For fiscal 2018, the Committee determined that the annual incentive plans for the CEO and other NEOs include a bonus modifier based on corporate performance measures and target goals that were designed to drive profitable growth and achieve strategic objectives. The modifier was focused on incentivizing superior achievement of the AMR long-term volume and operating income per ferrous ton growth targets identified and announced in April 2017. No application of a modifier would occur if the AMR operating income target was below target (1.0x) for the fiscal year.
| | | | | | | Notice of Annual Meeting of Shareholders and 2018 Proxy Statement | | | | 41 | |
| | |
| | Compensation Discussion and Analysis
|
For the CEO, if achieved, a maximum bonus modifier of up to 15% would be applied to each of the two components of the APBP payout, provided that application of the modifier did not change the maximum bonus under each component. Because the financial performance component of the APBP had been achieved at the maximum 3x payout in fiscal 2018, the bonus modifier was not applied to that component. For the other NEOs, if achieved, a maximum bonus modifier of up to 15% would be applied to each NEO’s total AICP payout.
Payout under the bonus modifier was based on the achievement of the specific volume and operating income targets as determined by the Committee and described below.
Annual Performance Bonus Program for the CEO.The employment agreement between the Company and the CEO provides for an annual bonus program consisting of two parts: a bonus based on achievement of Company financial performance goals and a bonus based on achievement of management objectives, each of which comprise 50% of the total bonus. The total target bonus opportunity under both components for each fiscal year is stated in her employment agreement to be 150% of her base salary as of the fiscalyear-end, with half of the total target bonus allocated to each part. The CEO’s employment agreement also provides that the maximum bonus payment is 3x target. The CEO’s target bonus percentage and maximum bonus percentage have remained unchanged since May 2011. For the first part of the CEO’s annual bonus program which is based on Company financial performance, and similar to fiscal 2017, the Committee established Adjustedadjusted EBITDA and adjusted EPS as the sole metricrelevant metrics for the financial performance component of the CEO’s fiscal 20182021 annual bonus program. The second part of the CEO’s annual bonus program is based on the achievement of management objectives established by the Committee. As part of its annual process, the Committee selects key objectives, the successful completion of which it believes will tie most closely to the achievement of the Company’s strategic objectives and be linked to the creation of long-term shareholder value. While the Committee believes that maintaining consistency in the objectives established fromyear-to-year is important, it makes changes as warranted by the Company’s strategic priorities and the overall market environment. The Committee established fourthree management objectives for fiscal 2018:2021: Improvement in our workplaceTo continue to improve the Company’s safety as measuredperformance and advance the Company’s EH&S culture by OSHAtracking leading environmental and safety metrics and a key leading indicator,performance activities, reflecting our ongoing, multi-year focus in this area.
Improvement in productivity and operating costs in connection with our strategy to increase productivity,
| | reduce costs, and drive synergies associated with the integration of CSS.
|
Achieving operating cash flow targets as a reflection of improved profitability and working capital management. Executing certain strategic objectives, including optimizing the Company’s operating platform, efficient use of capital, enhancing organizational structure and management development, volume growth, and increasing operating margins. The Committee determined that these representobjectives are strategically important strategic objectives for our business platform, and the focus on these metrics in the CEO’s fiscal 20182021 annual bonus program reflects the vital role the CEO’s leadership plays in ensuring execution of the Company’s strategic plan. Measurement of the achievement of these strategic objectives by the Committee is based on the annual performance evaluation of the CEO and on quantitative factors with respect to the metrics relating to volume growth, operating margin, and capital. The Committee chose these management objectives since theyit considered achievement of such goals as critical to both the immediate and long-term profitability of the Company. In particular, theythe Committee assigned a weighting of 40% of the management objectives component of the CEO’s annual bonus performance program (overall APBP weighting of 20%) to the strategic objectives because they viewed achievement of those objectives as not only benefiting fiscal 20182021 earnings and operating cash flow but also as being critical to future Company performance and shareholder value. For fiscal 2018:2021: Target for Adjustedadjusted EBITDA at $150 million was set at 69% higher than estimated fiscal 2020 results. Target for adjusted EPS at $1.90$2.06 was set significantly above the fiscal 20172020 actual result of $1.53. For the safety metrics, the performance targets reflected relative improvements in the safety metrics from their respective fiscal 2017 levels.$0.53.
The productivityEH&S metric targets reflectedwere based on improvements from their respectiveselected historical levels, progress toward industry benchmarks, and our ongoing focus on improving the scope, quality and effectiveness of these metrics, including the inclusion in fiscal 2017 levels. The target for adjusted operating cash flow for fiscal 2018 was based on assumptions regarding improved operating margins2021 of an EH&S scorecard to track leading environmental and working capital.
The bonus modifier was based on superior achievementsafety performance activities across the entirety of the AMR volume and AMR operating income per ferrous ton long-term growth targets identified and announced in April 2017.Company’s operations.
Thenon-income statement metrics (i.e., safety performance, productivity improvement, and operating cash flow) were capped at 0.5x in the event adjusted earnings per share were negative.
| | | | | 42 | | | Notice of Annual Meeting of Shareholders and 20182021 Proxy Statement | | | 48 |
| | |
| | Compensation Discussion and Analysis |
The target for adjusted operating cash flow at $114 million was based on assumptions regarding increased operating income and volumes, and changes in working capital. The non-income statement metrics in the annual incentive plans (i.e., EH&S performance and operating cash flow) would be capped at 0.5x if adjusted EPS were negative and at 1.0x if adjusted EPS were below 0.25x of target. Fiscal 2021 APBP Results Strong performance on both the financial and management objectives components driven in large part by the significant increase in adjusted EPS and adjusted EBITDA year-over-year and the results in the adjusted operating cash flow and strategic objectives metrics. Our fiscal 2021 results represent the best operating performance in a decade, including the highest EPS since fiscal 2008. We strengthened our core operations through productivity initiatives, progressed strategic investments in advanced metal recovery technologies and increased our sales volumes. Our profitability led to strong operating cash flow, which enabled us to reduce our debt to the lowest level since 2005, while continuing to return capital to shareholders and invest in our strategic initiatives to deliver growth. Fiscal 2021 was the safest year recorded in our Company’s 116-year history. This is the third consecutive year that we achieved a historical best recordable incident rate, and 93% of our facilities did not experience a lost time injury in fiscal 2021. We operated continuously throughout the COVID-19 crisis, deploying health, safety, and wellness protocols, rolled out training, and engaged in steady communications across our platform to ensure the safety of our people, our customers, our suppliers, and all who visit our sites. The overall multiple for performance during fiscal 2021 under the APBP was 2.79x. Total cash annual incentive payment to the CEO for fiscal 2021 under the APBP was $4.97 million. This amount is included in the “Non-Equity Incentive Plan Compensation” column of the “Summary Compensation Table.” The following table shows the fiscal 20182021 APBP goals and the results of each goal: Fiscal 20182021 APBP Results | | | | | | | | | | | | | | | | | | | | | | | | | | | | | | | | | | | | | | | | Financial Performance Goal and Management Objectives | | | | | | | | | | | | | | | Metric | | 0.0x | | | 0.25x | | | 1.00x | | | 2.00x | | | 3.00x | | | Results | | | Payout
Multiple | | | Weighting | | | Total | | Adjusted EPS(1) | | $ | 0 | | | $ | 1.08 | | | $ | 1.90 | | | $ | 2.55 | | | $ | 2.88 | | | $ | 5.64 | | | | 3.00 | | | | 50 | % | | | | | Safety: | | | | | | | | | | | | | | | | | | | | | | | | | | | | | | | | | | | | | AMR | | | | | | | | | | | | | | | | | | | | | | | | | | | | | | | | | | | | | TCIR | | | 4.19 | | | | 3.91 | | | | 3.56 | | | | 2.85 | | | | 2.49 | | | | 4.00 | | | | | | | | | | | | | | LSO | | | 25,924 | | | | 26,572 | | | | 27,220 | | | | 28,516 | | | | 29,165 | | | | 33,505 | | | | | | | | | | | | | | LTIR | | | 0.65 | | | | 0.56 | | | | 0.47 | | | | 0.38 | | | | 0.33 | | | | 0.97 | | | | | | | | | | | | | | AMR Average Multiple | | | | | | | | | | | | | | | | | | | | | | | | | | | 0.06 | | | | | | | | | | CSS | | | | | | | | | | | | | | | | | | | | | | | | | | | | | | | | | | | | | TCIR | | | 7.79 | | | | 6.41 | | | | 5.06 | | | | 4.05 | | | | 3.54 | | | | 5.97 | | | | | | | | | | | | | | LSO | | | 2,061 | | | | 2,238 | | | | 2,415 | | | | 2,616 | | | | 2,717 | | | | 3,389 | | | | | | | | | | | | | | LTIR | | | 3.08 | | | | 2.75 | | | | 2.17 | | | | 1.71 | | | | 1.48 | | | | 1.29 | | | | | | | | | | | | | | CSS Average Multiple | | | | | | | | | | | | | | | | | | | | | | | | | | | 2.16 | | | | | | | | | | Weighted Average Safety multiple(2) | | | | | | | | | | | | | | | | | | | | | | | | | | | 0.48 | | | | 10 | % | | | | | Productivity Improvements (in millions) | | $ | 0 | | | $ | 7.0 | | | $ | 11.4 | | | $ | 16.7 | | | $ | 19.4 | | | $ | 2.6 | | | | 0.09 | | | | 10 | % | | | | | Adjusted Operating Cash Flow (in millions)(3) | | $ | 0 | | | $ | 73 | | | $ | 100 | | | $ | 122 | | | $ | 132 | | | $ | 164 | | | | 3.00 | | | | 10 | % | | | | | Strategic Objectives(4) | | | | | | | | | | | | | | | | | | | | | | | | | | | 3.00 | | | | 20 | % | | | | | Weighted average payout multiple before bonus modifier | | | | | | | | | | | | | | | | | | | | | | | | | | | | | | | | | | | 2.46 | | Bonus Modifier Metrics | | 0% | | | 3.75% | | | 7.5% | | | 11.25% | | | 15% | | | | | | | | | | | | | | AMR Ferrous Sales Volumes (tons, 000s) | | | 3,425 | | | | 3,464 | | | | 3,504 | | | | 3,543 | | | | 3,582 | | | | 3,708 | | | | | | | | 7.5 | % | | | | | AMR Operating Income per Ferrous Ton | | $ | 32.7 | | | $ | 34.6 | | | $ | 36.4 | | | $ | 38.3 | | | $ | 40.2 | | | $ | 45.9 | | | | | | | | 7.5 | % | | | | | Bonus modifier achievement | | | | | | | | | | | | | | | | | | | | | | | | | | | 15 | %(5) | | | | | | | | | Weighted average payout multiple after bonus modifier | | | | | | | | | | | | | | | | | | | | | | | | | | | | | | | | | | | 2.60 | |
| | | | | | | | | | | | | | | | | | | | | | | | | | | | | | | | | | | | | | | | | | Financial Performance Goal and Management Objectives | | | | Payout
Multiple | | | | | | Metric | | | | 0.0x | | | | | 0.25x | | | | | 1.00x | | | | | 2.00x | | | | | 3.00x | | Results | | Weighting | | Total | Adjusted EPS(1) | | $ | | 0 | | $ | | | | 0.86 | | $ | | | | 2.06 | | $ | | | | 3.33 | | $ | | | | 3.83 | | $ 6.23 | | 3.00 | | 25% | | | Adjusted EBITDA(2) | | $ | | 72 | | $ | | | | 105 | | $ | | | | 150 | | $ | | | | 194 | | $ | | | | 212 | | $ 294 | | 3.00 | | 25% | | | EH&S: | | | | | | | | | | | | | | | | | | | | | | | | | | | | | | | | | | | | | Metals | | | | | | | | | | | | | | | | | | | | | | | | | | | | | | | | | | | | | TCIR | | | | 1.78 | | | | | | 1.74 | | | | | | 1.51 | | | | | | 1.42 | | | | | | 1.34 | | 1.25 | | | | | | | LTIR | | | | 0.37 | | | | | | 0.36 | | | | | | 0.33 | | | | | | 0.31 | | | | | | 0.29 | | 0.35 | | | | | | | EH&S Scorecard | | | | 65% | | | | | | 75% | | | | | | 90% | | | | | | N/A | | | | | | N/A | | 96% | | | | | | | Metals Average Multiple | | | | | | | | | | | | | | | | | | | | | | | | | | | | | | | | 1.50 | | | | | Autos | | | | | | | | | | | | | | | | | | | | | | | | | | | | | | | | | | | | | TCIR | | | | 1.55 | | | | | | 1.51 | | | | | | 1.32 | | | | | | 1.24 | | | | | | 1.17 | | 2.07 | | | | | | | LTIR | | | | 0.82 | | | | | | 0.80 | | | | | | 0.70 | | | | | | 0.66 | | | | | | 0.63 | | 0.08 | | | | | | | EH&S Scorecard | | | | 65% | | | | | | 75% | | | | | | 90% | | | | | | N/A | | | | | | N/A | | 0.95 | | | | | | | Autos Average Multiple | | | | | | | | | | | | | | | | | | | | | | | | | | | | | | | | 1.33 | | | | | Steel Mill | | | | | | | | | | | | | | | | | | | | | | | | | | | | | | | | | | | | | TCIR | | | | 4.22 | | | | | | 4.11 | | | | | | 3.17 | | | | | | 2.95 | | | | | | 2.79 | | 3.04 | | | | | | | LTIR | | | | 2.24 | | | | | | 2.18 | | | | | | 1.68 | | | | | | 1.57 | | | | | | 1.49 | | 0.76 | | | | | | | EH&S Scorecard | | | | 65% | | | | | | 75% | | | | | | 90% | | | | | | N/A | | | | | | N/A | | 0.96 | | | | | | | Steel Mill Average Multiple | | | | | | | | | | | | | | | | | | | | | | | | | | | | | | | | 2.30 | | | | | EH&S Weighted Average Multiple(3) | | | | | | | | | | | | | | | | | | | | | | | | | | | | | | | | 1.59 | | 15% | | | Adjusted Operating Cash Flow (in millions)(4) | | $ | | 41 | | $ | | | | 74 | | $ | | | | 114 | | $ | | | | 153 | | $ | | | | 171 | | $ 206 | | 3.00 | | 15% | | | Strategic Objectives(5) | | | | | | | | | | | | | | | | | | | | | | | | | | | | | | | | 3.00 | | 20% | | | | | | | | | | | | | | | | | | | Payout Multiple Earned | | | | | | | | | | | | | | | | | | | | | | | | | | | | | | | | 2.79 |
| (1) | Adjusted EPS for fiscal 20182021 was defined as the Company’s reported diluted earnings per share for fiscal 20182021 before significantnon-recurring and extraordinary items and the cumulative effects of changes in accounting principles, adjusted to eliminate the impact of the following items: charges in |
| | | | Notice of Annual Meeting of Shareholders and 2021 Proxy Statement | | | 49 |
| | |
| | Compensation Discussion and Analysis |
| fiscal 20182021 for the impairment of goodwill or other assets (“Impairments”); changes in environmental liabilities recorded in fiscal 20182021 in connection with the Portland Harbor Superfund Site or certain other sites (the “Sites”) for investigation and remediation costs and natural resource or other damage claims (“Environmental Accruals”); the fines, penalties, indemnities, fees, costs and expenses incurred in fiscal 20182021 in connection with the Sites (net of any insurance or other reimbursements and excluding Environmental Accruals) (“Environmental Expenses”); restructuring charges and other exit-related expenses taken by the Company in fiscal 20182021 (“Restructuring Charges”); any impacts on net income, including financing charges, in fiscal 20182021 as a result of any business acquisitions or business combinations completed or reviewed (including incremental costs incurred solely as a result of the transaction, whether or not consummated) in fiscal 20182021 (“Acquisition Items”); any charges to reduce the recorded value of any inventory to net realizable value in connection with significant macroeconomic events (“NRV Charges”); incremental accelerated depreciation recorded in fiscal 2021 related to certain equipment assets which are made obsolete by new technology investments (“Accelerated Depreciation”); any charges taken by the Company in fiscal 2021 related to the settlement of any third-party claims in connection with an electricity utility matter (“Utility Charges”); any impacts in fiscal 2021 resulting from major changes in federal or state tax laws (“Tax Reform”); and the discrete income tax impact of the foregoing adjustments as certified by the Audit Committee based on recommendation of the Company’s CFO (“Tax Impacts”). |
| (2) | Weighted average safety multiple weighted 80% AMR,Adjusted EBITDA for fiscal 2021 was defined as the Company’s reported earnings before interest, taxes, depreciation and 20% CSS.amortization for fiscal 2021 before significant non-recurring and extraordinary items and the cumulative effects of changes in accounting principles, adjusted to eliminate the impact of the following items: Impairments; Environmental Accruals; Environmental Expenses; Restructuring Charges; Acquisition Items; NRV Charges; Accelerated Depreciation; Utility Charges; Tax Reform; and Tax Impacts.
|
| (3) | Weighted average EH&S multiple weighted 40% Metals, 40% Autos, and 20% Steel Mill. |
| (4) | Adjusted operating cash flow for fiscal 20182021 was defined as the Company’s net cash provided by operating activities for fiscal 20182021 before significantnon-recurring and extraordinary items and the cumulative effects of changes in accounting principles, adjusted to eliminate the cash impact of the following items: Environmental Expenses; Restructuring Charges; Acquisition Items; Accelerated Depreciation; Utility Charges; Tax Reform; and Tax Impacts. |
(4)(5) | See “Fiscal 20182021 APBP Results” below for a discussion of the strategic objectives metric. |
| | | | | | | Notice of Annual Meeting of Shareholders and 2018 Proxy Statement | | | | 43 | |
| | |
| | Compensation Discussion and Analysis
|
(5) | For the CEO, if achieved, a maximum bonus modifier of up to 15% would be applied to each of the two components of the APBP payout, provided that application of the modifier did not change the maximum bonus under each component. Because the financial performance component of the APBP had been achieved at the maximum 3x payout in fiscal 2018, the bonus modifier was not applied to that component, resulting in an overall 7.5% modifier being applied to the CEO’s APBP payout.
|
Fiscal 2018 APBP2021 AICP Results for Other NEOs Strong performance on both the financial and management objectives components driven in large part by the significant increase in adjusted EPS year-over-year and the results in the adjusted operating cash flow and strategic objectives metrics.
The achievement of the strategic objectives metric reflected the long-term goals which the CEO has implemented to significantly improve the Company’s operating profit, increase productivity, optimize our platform, and efficiently use our capital. In fiscal 2018, the Company delivered its strongest financial and operating performance in seven years. We also delivered accelerated achievement on our three-year plan for higher volumes and higher operating margins, hitting our fiscal 2019 targets in fiscal 2018, notwithstanding challenging ferrous and nonferrous scrap market dynamics during the fourth quarter. For the full year, AMR achieved operating income per ferrous ton of $46, a level last reached in fiscal 2011 when both volumes and scrap prices were significantly higher than during fiscal 2018. This operating performance demonstrates the operating leverage created in our platform by our focus on productivity improvements and commercial initiatives to increase supply flows. CSS also significantly expanded its operating margins through benefits from productivity improvements and higher steel prices.
The success of our strategic objectives are evidenced by our strong operating performance driven by our continued focus on productivity and commercial initiatives, including measures to increase supply flows and nonferrous processing improvements. Our focus on capital efficiency is demonstrated by improved profitability, and operating cash flow. Our strong operating cash flow allowed us to reduce our debt to its lowest level in eight years while also returning capital to our shareholders through our dividend and share repurchases. These strategies reflect our overarching focus on delivering operating and financial performance which supports long-term shareholder value.
Total cash annual incentive payment to the CEO for fiscal 2018 under the APBP was $4.3 million. This amount is
| | included in the“Non-Equity Incentive Plan Compensation” column of the “Summary Compensation Table.”
|
AICP for Other NEOs.Our NEOs, other than the CEO, participate in the AICP.
Recognizes overall Company performance divisional safety performance relevant to the applicable NEO, and contribution to the achievement of performance improvement initiatives.business line EH&S performance. Target bonuses based on a percentage of actual base salary paid during the fiscal year are established for the applicable NEO under the AICP. | | – | | Target bonus percentages remained unchanged for fiscal 2018 increased2021 for Messrs. Peach, (from 80% toHenderson and Heiskell at 100%), Henderson (from 80% to 100%), Heiskell (from 70% to 80%) and Dyck (from 65% toMr. Saba at 75%). |
| | – | | Differences in target bonus percentages among the NEOs reflect their varying levels of responsibility, expertise, experiences, development within roles, and positions within the industry. |
For fiscal 2018,2021, the Committee established a series of performance targets based on the Company’s Adjustedadjusted EPS, safety, productivity improvements,adjusted EBITDA, EH&S, and operating cash flow, which utilized the same adjustments as in the fiscal 20182021 APBP. In addition, consistent with the metrics used in the fiscal 20182021 APBP, the Committee determined to use adjusted operating cash flow productivity improvements, and workplace safetyEH&S performance as the other operating metrics for the fiscal 20182021 AICP to complement the financial AICP metric.metrics. Also consistent with the fiscal 20182021 APBP, thenon-income statement metrics under the fiscal 20182021 AICP (i.e., safetyEH&S performance productivity improvements, and operating cash flow) werewould be capped at 0.5x in the event adjusted earnings per shareEPS were negative.negative and at 1.0x if adjusted EPS were below threshold (0.25x). For additional discussion on the target levels set for each of the fiscal 20182021 AICP performance goals, see the discussion of that goal under the fiscal 20182021 APBP on page 42.49. | | | | | 44 | | | Notice of Annual Meeting of Shareholders and 20182021 Proxy Statement | | | 50 |
| | |
| | Compensation Discussion and Analysis |
The following table shows the fiscal 20182021 AICP performance goals and the results of each goal: Fiscal 20182021 AICP Performance Goals | | | | | | | | | | | | | | | | | | | | | | | | | | | | | | | | | | | | | | | | Performance Goals | | | | | | | | | | | | | | Metric | | | | | 0.25x | | | 1.00x | | | 2.00x | | | | | | Results | | | Payout
Multiple | | | Weighting | | | Total | | Adjusted EPS | | | | | | $ | 1.08 | | | $ | 1.90 | | | $ | 2.55 | | | | | | | $ | 5.64 | | | | 2.00 | | | | 55% | | | | | | Safety: | | | | | | | | | | | | | | | | | | | | | | | | | | | | | | | | | | | | | AMR | | | | | | | | | | | | | | | | | | | | | | | | | | | | | | | | | | | | | TCIR | | | | | | | 3.91 | | | | 3.56 | | | | 2.85 | | | | | | | | 4.00 | | | | | | | | | | | | | | LSO | | | | | | | 26,572 | | | | 27,220 | | | | 28,516 | | | | | | | | 33,505 | | | | | | | | | | | | | | LTIR | | | | | | | 0.56 | | | | 0.47 | | | | 0.38 | | | | | | | | 0.97 | | | | | | | | | | | | | | AMR Average Multiple | | | | | | | | | | | | | | | | | | | | | | | | | | | 0.00 | | | | | | | | | | CSS | | | | | | | | | | | | | | | | | | | | | | | | | | | | | | | | | | | | | TCIR | | | | | | | 6.41 | | | | 5.06 | | | | 4.05 | | | | | | | | 5.97 | | | | | | | | | | | | | | LSO | | | | | | | 2,238 | | | | 2,415 | | | | 2,616 | | | | | | | | 3,389 | | | | | | | | | | | | | | LTIR | | | | | | | 2.75 | | | | 2.17 | | | | 1.71 | | | | | | | | 1.29 | | | | | | | | | | | | | | CSS Average Multiple | | | | | | | | | | | | | | | | | | | | | | | | | | | 1.50 | | | | | | | | | | Weighted Average Safety multiple(1) | | | | | | | | | | | | | | | | | | | | | | | | | | | 0.30 | | | | 15% | | | | | | Productivity Improvements (in millions) | | | | | | $ | 7.0 | | | $ | 11.4 | | | $ | 16.7 | | | | | | | $ | 2.6 | | | | 0.00 | | | | 15% | | | | | | Adjusted Operating Cash Flow (in millions) | | | | | | $ | 73 | | | $ | 100 | | | $ | 122 | | | | | | | $ | 164 | | | | 2.00 | | | | 15% | | | | | | Weighted average payout multiple before bonus modifier | | | | | | | | | | | | | | | | | | | | | | | | | | | | | | | | | | | 1.45 | | Bonus Modifier Metrics | | 0% | | | 3.75% | | | 7.5% | | | 11.25% | | | 15% | | | | | | | | | | | | | | AMR Ferrous Sales Volumes (tons, 000s) | | | 3,425 | | | | 3,464 | | | | 3,504 | | | | 3,543 | | | | 3,582 | | | | 3,708 | | | | | | | | 7.5% | | | | | | AMR Operating Income per Ferrous Ton | | $ | 32.7 | | | $ | 34.6 | | | $ | 36.4 | | | $ | 38.3 | | | $ | 40.2 | | | $ | 45.9 | | | | | | | | 7.5% | | | | | | Bonus modifier achievement | | | | | | | | | | | | | | | | | | | | | | | | | | | 15 | % | | | | | | | | | Payout multiple after bonus modifier | | | | | | | | | | | | | | | | | | | | | | | | | | | | | | | | | | | 1.66 | |
| | | | | | | | | | | | | | | | | | | | | | | | | | | | | | | | | | | | | | Performance Goals | | | | | | Payout Multiple | | | | | | | | | Metric | | 0.25x | | | 1.00x | | | 2.00x | | | Results | | | Weighting | | | Total | | Adjusted EPS | | $ | 0.86 | | | $ | 2.06 | | | $ | 3.33 | | | $ | 6.23 | | | | 2.00 | | | | 25 | % | | | | | Adjusted EBITDA | | $ | 105 | | | $ | 150 | | | $ | 194 | | | $ | 294 | | | | 2.00 | | | | 35 | % | | | | | EH&S: | | | | | | | | | | | | | | | | | | | | | | | | | | | | | Metals | | | | | | | | | | | | | | | | | | | | | | | | | | | | | TCIR | | | 1.74 | | | | 1.51 | | | | 1.42 | | | | 1.25 | | | | | | | | | | | | | | LTIR | | | 0.36 | | | | 0.33 | | | | 0.31 | | | | 0.35 | | | | | | | | | | | | | | EH&S Scorecard | | | 75 | % | | | 90 | % | | | N/A | | | | 96 | % | | | | | | | | | | | | | Metals Average Multiple | | | | | | | | | | | | | | | | | | | 1.17 | | | | | | | | | | Autos | | | | | | | | | | | | | | | | | | | | | | | | | | | | | TCIR | | | 1.51 | | | | 1.32 | | | | 1.24 | | | | 2.07 | | | | | | | | | | | | | | LTIR | | | 0.80 | | | | 0.70 | | | | 0.66 | | | | 0.08 | | | | | | | | | | | | | | EH&S Scorecard | | | 75 | % | | | 90 | % | | | N/A | | | | 95 | % | | | | | | | | | | | | | Autos Average Multiple | | | | | | | | | | | | | | | | | | | 1.00 | | | | | | | | | | Steel Mill | | | | | | | | | | | | | | | | | | | | | | | | | | | | | TCIR | | | 4.11 | | | | 3.17 | | | | 2.95 | | | | 3.04 | | | | | | | | | | | | | | LTIR | | | 2.18 | | | | 1.68 | | | | 1.57 | | | | 0.76 | | | | | | | | | | | | | | EH&S Scorecard | | | 75 | % | | | 90 | % | | | N/A | | | | 96 | % | | | | | | | | | | | | | Steel Mill Average Multiple | | | | | | | | | | | | | | | | | | | 1.79 | | | | | | | | | | EH&S Weighted Average Multiple(1) | | | | | | | | | | | | | | | | | | | 1.23 | | | | 15 | % | | | | | Adjusted Operating Cash Flow (in millions) | | $ | 74 | | | $ | 114 | | | $ | 153 | | | $ | 206 | | | | 2.00 | | | | 25 | % | | | | | | | | | | | | | Payout Multiple Earned | | | | | | | | | | | | | | | | | | | | | | | | | | | 1.88 | |
| (1) | Weighted average safetyEH&S multiple weighted 80% AMR,40% Metals, 40% Autos, and 20% CSS.Steel Mill. |
The following table summarizes the overall AICP results and payouts: | | | | | | | | | Named Executive Officer | | Overall Multiple | | | Payout | | Richard D. Peach | | | 1.66 | | | $ | 1,097,005 | | Michael R. Henderson | | | 1.66 | | | $ | 932,601 | | Steven G. Heiskell | | | 1.66 | | | $ | 622,204 | | Jeffrey Dyck | | | 1.66 | | | $ | 582,516 | |
Long-Term Incentive Program.All of our NEOs participate in the LTIP, which consists of two components: RSUs (time-vested awards) and performance shares (performance-based awards). As described below, performance share awards granted in fiscal 2018 had two components: the TSR component and the ROCE component. LTIP award values are split equally between RSUs and performance shares. In determining the 50/50 split between RSUs and performance
shares, the Committee considered several factors, including (i) the relatively longer5-year vesting period of the Company’s RSUs as compared to the typical3-year vesting schedule for restricted stock and stock options adopted by our peers; (ii) the cyclical nature of our business makes it difficult to assess forward-looking performance; and (iii) stock price volatility within the TSR component of the performance share awards is often driven by market forces beyond our control.
| | | | | | | Notice of Annual Meeting of Shareholders and 2018 Proxy Statement | Named Executive Officer | | | 45Payout(1) | |
| | |
| | $ | Compensation Discussion and Analysis1,380,719
| |
Michael R. Henderson | | $ | 1,192,740 | | Steven G. Heiskell | | $ | 1,044,826 | | Peter B. Saba | | $ | 739,302 | |
| (1) | These amounts are included in the “Non-Equity Incentive Plan Compensation” column of the “Summary Compensation Table” for each of these NEOs. |
The award value for performance shares covering the fiscal 2018-2020 performance period was split equally between the TSR component and the ROCE component, with the number of RSUs and the target number of performance shares under the ROCE component calculated based on the closing market price of our common stock on the determination date and the target number of performance shares under the TSR component calculated based on the fair value per share of the TSR component as determined for accounting purposes.Long-Term Incentive Program
LTIP awards are made by the Committee pursuant to our Policy on Employee Equity Awards, which was adopted by the Board in April 2007 and sets forth the process for granting equity awards. LTIP awards made to NEOs are generally made based on grant guidelines expressed as a percentage of salary. Grant guidelines for NEOs other than the CEO are developed each year based on a review of (a) market-based LTIP grant levels, as assessed by both the Committee’s and management’s consultants, (b) prior year grant guidelines,levels, and (c) CEO recommendations, taking into account performance and internal pay equity considerations, including the relative scope of the business responsibilities of each NEO, the markets in which his or her business segment operates, and his or her individual performance. Grant guidelines for the CEO are developed each year by the Committee based on a review of market-based LTIP grant levels, and prior year grant guidelineslevels, and an exercise of its discretion, taking into account CEO performance. Our practice generally has been to determine annual LTIP award levels and to make both RSUgrants in November of each fiscal year. The grant date fair values of LTIP awards made to each of our NEOs are disclosed in the “Stock Awards” column of the “Summary Compensation Table”. LTIP award values are split equally between RSUs (time-vested awards) and performance shares (performance-based awards). In determining the 50/50 split between RSUs and performance shares, the Committee considered several factors, including (i) the relatively longer five-year vesting period of the Company’s RSUs as compared to the typical three- | | | | Notice of Annual Meeting of Shareholders and 2021 Proxy Statement | | | 51 |
| | |
| | Compensation Discussion and Analysis |
year vesting schedule for restricted stock and stock options adopted by our peers; (ii) the cyclical nature of our business, which makes it difficult to assess forward-looking performance; and (iii) stock price volatility within the TSR component of the performance share awards in November of the fiscal year. RSU awards generally vest over five years, and awards under the performance share component have historically had a three-year performance cycle. We modified this historical practice in fiscal 2012 through fiscal 2015 and used atwo-year performance cycle because the Committee determined that continuing(as discussed further below), which is often driven by market uncertainties made establishing three-year performance targets extremely difficult. In response to the input received through the Company’s shareholder outreach efforts, the Committee returned to the three-year performance cycle for awards made in fiscal 2016 and thereafter.forces beyond our control. Fiscal 2021 Grants.The LTIP award level approved in fiscal 20182021 for the CEO was 318%316% of her base salary at the time of the award. The grant levels for the other NEOs as a percentage of base salary were 150%136% for Mr. Peach, 123% for Mr. Henderson, 144%141% for Mr. Heiskell, and 108%99% for Mr. Dyck.Saba. These grants placed the officers at the levels deemed by the Committee to be appropriate and reasonable in light of their respective performance, expertise, experience, and development within roles and responsibilities. In designing the LTIP, the Committee sought to make awards within a broad range on either side of the market median to individualize the award to the level of responsibility and performance of the recipient. RSUs.RSUs.The objective of RSUs is to align executive and shareholder long-term interests by creating a strong and direct link between executive compensation and shareholder return and to create incentives for NEOs to remain with the Company for the long term. Awarded RSUs generally vest over five years. Since fiscal 2007, we have granted RSUs instead of stock options to NEOs and other key employees to increase the equity ownership of senior management and provide a time-based retention incentive that the Committee believes better meets its compensation and retention objectives. RSU awards under the LTIP are generally made pursuant to our standard form of restricted stock unit award agreement. See “All Other Stock Awards: Number of Shares of Stock or Units” in the “Grants of Plan-Based Awards in Fiscal 2018”2021” table. Performance Shares.Performance-based long-term incentive awards payable in our common stock are designed to focus our NEOs on the achievement of long-term objective performance goals established by the Committee and vest only to the extent those performance goals are met. Because awards are based on a three-year performance period, they maximize the leverage of both short- and long-term performance. The impact of a single year’s performance is felt in each of three performance share grants that are outstanding at any given time, so that strong performance must be sustained every year in order to provide favorable payouts. This element of executive compensation closely connects NEOs to the Company’s financial and stock performance over the short- and long-term and acts as a retention tool.long-term. Selection of Fiscal 2018-2020 Performance Measures.For performance shares awarded in November 2017, the following metrics were utilized:
TSR relative to a peer group of companies with similar financial and operational characteristics; and
ROCE against specific targets over the performance period.
We believe TSR is an appropriate measure because it inherently reflects relevant financial and operational results as share price is a reflection of our current and expected future performance and directly links a significant portion of NEO compensation to shareholder value creation. ROCE, which measures how effectively we employ our capital over time, was chosen to promote efficient use of capital and long-term growth to create sustainable value for our shareholders. ROCE balances the cyclical nature of commodity prices and the investments required to support working capital.
In tandem, we believe that these metrics drive the behaviors of our management team in ways that are intended to create the most value for our shareholders.
| | | | | 46 | | | Notice of Annual Meeting of Shareholders and 2018 Proxy Statement |
| | |
| | Compensation Discussion and Analysis
|
TSR, including reinvested dividends, will be calculated for each year of the three-year performance period for the Company and each performance peer group company, except that for the first year of the performance period TSR is measured from the grant date of the award to the fiscal year end. The TSR of the Company and each of the performance peer group companies is then ranked based on their
respective TSR’s from lowest to highest. The average of the Company’s TSR percentile rank for each of the three fiscal years will then be used to determine the overall relative level of TSR performance. The TSR payout level will be based on the percentile rank of our average TSR as compared to the performance peer group, as follows:
| | | Average TSR Percentile Rank
| | TSR Payout
Factor
| less than 25%
| | 0.0x | 25%
| | 0.5x | 50%
| | 1.0x | 90% or more
| | 2.0x |
The Compensation Committee determined that using an average of the Company’s relative TSR for each year of the three-year performance period was warranted to limit the possibility of disproportionate payouts, either positive or negative, as a result of sharp stock price movements toward the end of the three-year performance period. The performance share award also contains a “positive TSR” modifier whereby if our TSR is negative when measured over the full performance period, the maximum TSR payout factor is limited to 1.0x even if the relative TSR would have resulted in a greater payout factor. In addition, the performance share award contains an overall cap which provides that the maximum value (including stock price appreciation) of shares payable under the TSR metric at the time of payment is limited to 4.0x the value of the target number of shares under the TSR metric on the date of grant of the performance share award. See “The Executive Compensation Process – Competitive Market Overview” for the listing of performance peer group companies used in fiscal 2018.
The ROCE metric is based on the average of the ROCEs achieved by the Company in each of the three years of the performance period. ROCE for each year is defined as (a) net
income, excluding interest expense, divided by (b) average capital employed which is generally equal to total assets minus total liabilities other than debt and capital lease obligations. ROCE for each fiscal year will be adjusted to eliminate the impacts of impairments of goodwill or other assets; certain environmental accruals and expenses; restructuring charges and other exit-related activities; business acquisitions or combinations completed or reviewed in fiscal 2020; changes in accounting principles; charges to reduce the recorded value of any inventory to net realizable value; and the discrete income tax impact of the foregoing adjustments.
The Committee established the ROCE performance targets based on a variety of factors, including our budget for fiscal 2018, recent historical performance, most recent forecasts and expected impacts of growth initiatives, expected returns on capital expenditures and other uses of capital, and the cyclical nature of our business. In light of these circumstances, the Committee believes this three-year target is challenging but achievable. The ROCE payout level will be determined as follows:
| | | Three-Year Average ROCE Performance
| | ROCE Payout
Factor
| More than 3% below target
| | 0% | 3% below target
| | 50% | At Target
| | 100% | 2.40% or more above target
| | 200% |
We consider the ROCE targets for uncompleted performance periods to be confidential financial information, the disclosure of which would result in competitive harm to us because they
would reveal information about our growth profile and the effects of anticipated capital expenditures and corporate acquisitions, none of which is otherwise made public.
| | | | | | | Notice of Annual Meeting of Shareholders and 2018 Proxy Statement | | | | 47 | |
| | |
| | Compensation Discussion and Analysis
|
Final performance share awards are calculated as follows:
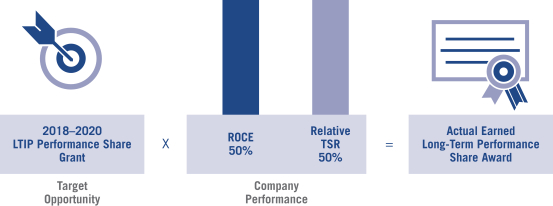
Summary of Outstanding Performance Awards
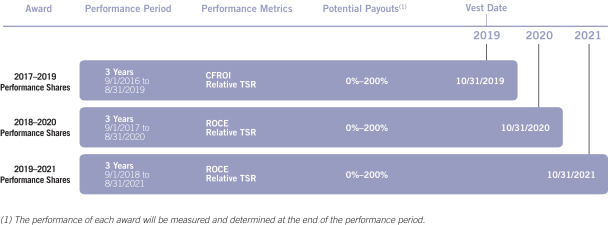
Fiscal 2016-2018 Results and Payouts.In recognition of market conditions existing at the time, the Committee determined that for fiscal 2016 it would consider the long-term incentive awards in two stages: a grant in November 2015 at generally 50% of the previous year grant levels and a reviewat mid-year based on the Company’s financial and operating performance for the remaining 50%. Based onthat mid-year review, in April 2016, the Committee determined to grant the second half of fiscal 2016 LTIP awards. For performance shares awarded in November 2015, the performance period was set at three years. When granting the second half of fiscal 2016 performance shares in April 2016, the Committee set the performance period as the remaining 2 1/2 years of the fiscal 2016-2018 period.
For both fiscal 2016 performance share awards, the following metrics were utilized:
TSR relative to a peer group of companies with similar financial and operational characteristics (weighted at 50%); and
CFROI against specific targets over the performance period (weighted at 50%).
TSR was defined essentially the same as that term was defined in the fiscal 2018-2020 awards described above. The CFROI metric was based on average of the CFROIs achieved by the Company in each of the three years of the performance period. CFROI for each year was defined as (a) net cash provided by operating activities less net capital expenditures, divided by (b) average capital employed which is generally equal to total assets minus total liabilities other than debt and capital lease obligations. CFROI for each fiscal year was adjusted to eliminate the impacts of impairments of goodwill or other assets; certain environmental expenses; restructuring charges and other exit-related activities announced in final six months of fiscal 2018; business acquisitions or combinations completed or reviewed in fiscal 2018; discrete income tax adjustments; and changes in accounting principles.
| | | | | 48 | | | Notice of Annual Meeting of Shareholders and 2018 Proxy Statement |
| | |
| | Compensation Discussion and Analysis
|
The performance goals, results, and associated performance payout for the CFROI metric for the three-year performance period ended August 31, 2018 were as follows:
| | | | | | | | | | | | | | | | | | | | | | | | | | | | CFROI Goals | | | | | | | | LTIP Measure | | Weight | | | Threshold | | | Target | | | Stretch | | | Results | | | Performance
Payout | | CFROI | | | 50 | % | | | 3.7 | % | | | 7.0 | % | | | 9.0 | % | | | 9.7 | %(1) | | | 200 | % |
(1) | Represents the weighted average of CFROI for fiscal 2016 to 2018. CFROI for fiscal 2016, 2017 and 2018 was 8.8%, 8.5% and 11.7%, respectively.
|
The performance goals, results, and associated payout factor for the relative TSR metric for the three-year performance period ended August 31, 2018 were as follows:
| | | | | | | | | | | | | | | | | | | | | | | | | | | | Average TSR Percentile Rank | | | | | | | | LTIP Measure | | Weight | | | Threshold | | | Target | | | Stretch | | | Results | | | Payout Factor | | Relative TSR | | | 50 | % | | | 25 | % | | | 50 | % | | | 90 | % | | | 46.8 | %(1) | | | 0.94x | |
(1) | Represents the weighted average of relative TSR for fiscal 2016 to 2018. Relative TSR for fiscal 2016, 2017 and 2018 was 27.8%, 68.8% and 43.9%, respectively.
|
The performance goals, results, and associated performance payout for the CFROI metric for the 2 1/2-year performance period ended August 31, 2018 were as follows:
| | | | | | | | | | | | | | | | | | | | | | | | | | | | CFROI Goals | | | | | | | | LTIP Measure | | Weight | | | Threshold | | | Target | | | Stretch | | | Results | | | Performance
Payout | | CFROI | | | 50 | % | | | 3.7 | % | | | 7.0 | % | | | 9.0 | % | | | 10.2 | %(1) | | | 200 | % |
(1) | Represents the weighted average of CFROI for the 21/2-year performance period ended August 31, 2018. CFROI for the second half of fiscal 2016 was 8.8% and for fiscal 2017 and 2018 was 8.9% and 12.1%, respectively.
|
The performance goals, results, and associated payout factor for the relative TSR metric for the 2 1/2-year performance period ended August 31, 2018 were as follows:
| | | | | | | | | | | | | | | | | | | | | | | | | | | | Average TSR Percentile Rank | | | | | | | | LTIP Measure | | Weight | | | Threshold | | | Target | | | Stretch | | | Results | | | Payout Factor | | Relative TSR | | | 50 | % | | | 25 | % | | | 50 | % | | | 90 | % | | | 47.3 | %(1) | | | 0.95x | |
(1) | Represents the weighted average of relative TSR for the 21/2-year performance period ended August 31, 2018. Relative TSR for the second half of fiscal 2016 was 11.3% and for fiscal 2017 and 2018 was 68.8% and 43.9%, respectively.
|
Based on these results, the aggregate average payout multiple for these awards was 1.48x. The number of shares issued to each NEO under these awards following vesting on October 31, 2018 is shown in the “Outstanding Equity Awards at Fiscal 2018Year-End” table.
A participant generally must be employed by us on the October 31 following the end of the performance period to receive an award payout, although adjusted awards,pro-rated based on the period of employment during the performance period, will be paid subject to the terms of the applicable award agreement if employment terminates earlier on account of death, disability, retirement, termination without cause after the first year of the performance period, or a sale of the Company. Awards will be paid in Class A common stock as soon as practicable after the October 31 following the end of the performance period. Violation of certainnon-competition covenants during the first year following termination of employment will trigger an obligation to repay any award paid out in the preceding year. See the “Stock Awards” column in the “Summary Compensation Table” and “Estimated Future Payouts Under Equity Incentive Plan Awards” column in the “Grants of Plan-Based Awards in Fiscal 2018”2021” table. Selection of Fiscal 2021-2023 Metrics for Performance Shares.For performance shares awarded in November 2020, the following metrics were utilized: TSR relative to a peer group of companies with similar financial and operational characteristics; and ROCE against specific targets over the performance period. We believe TSR is an appropriate measure because it inherently reflects relevant financial and operational results as share price is a reflection of our current and expected future performance, and it directly links a significant portion of NEO compensation to shareholder value creation. ROCE, which measures how effectively we employ our capital over time, was chosen to promote efficient use of capital and long-term growth to create sustainable value for our shareholders. ROCE balances the cyclical nature of commodity prices and the investments required to support working capital. In tandem, we believe that these two metrics drive the behaviors of our management team in ways that are intended to create the most value for our shareholders. | | | | Notice of Annual Meeting of Shareholders and 2021 Proxy Statement | | | 52 |
| | |
| | Compensation Discussion and Analysis |
The below chart summarizes the calculation and expected payouts under the relative TSR and ROCE metrics, respectively: | | | | | | | | | | TSR | | ROCE | Calculation | | TSR, including reinvested dividends, will be calculated for each year of the three-year performance period for the Company and each performance peer group company, except that for the first year of the performance period TSR is measured from the grant date of the award to the fiscal year end. The TSR of the Company and each of the performance peer group companies is then ranked based on their respective TSR’s from lowest to highest. The average of the Company’s TSR percentile rank for each of the three fiscal years will then be used to determine the overall relative level of TSR performance. | | The ROCE metric is based on the average of the ROCE achieved by the Company in each of the three years of the performance period. ROCE for each year is defined as (a) net income, excluding interest expense, divided by (b) average capital employed which is generally equal to total assets minus total liabilities other than debt and finance lease liabilities. ROCE for each fiscal year will be adjusted to eliminate the impacts of impairments of goodwill or other assets; certain environmental accruals and expenses; restructuring charges and other exit-related activities; business acquisitions or combinations completed or reviewed in fiscal 2023; incremental accelerated depreciation related to certain equipment assets which are made obsolete due to new technology investments; charges related to the settlement of any third-party claims in connection with an electricity utility matter; changes in accounting principles; charges to reduce the recorded value of any inventory to net realizable value; major changes in federal or state tax laws; and the discrete income tax impact of the foregoing adjustments. | | | | Considerations | | The Compensation Committee determined that using a three-year average of the Company’s relative TSR in each year of the performance period was warranted to limit the possibility of disproportionate payouts, either positive or negative, as a result of sharp stock price movements toward the end of the three-year performance period. The performance share award also contains a “positive TSR” modifier whereby if our TSR is negative when measured over the full performance period, the maximum TSR payout factor is limited to 1.0x even if the relative TSR would have resulted in a greater payout factor. In addition, the performance share award contains an overall cap which provides that the maximum value (including stock price appreciation) of shares payable under the TSR metric at the time of payment is limited to 4.0x the value of the target number of shares under the TSR metric on the date of grant of the performance share award. See “The Executive Compensation Process – Competitive Market Overview” for the listing of performance peer group companies used in fiscal 2021. | | The Committee established the ROCE performance targets based on a variety of factors, including our projected operating budgets, recent historical performance, most recent forecasts and expected impacts of growth initiatives, expected returns on capital expenditures and other uses of capital, and the cyclical nature of our business. In light of these circumstances, the Committee believes this three-year target is challenging but achievable. |
| | | | Notice of Annual Meeting of Shareholders and 2021 Proxy Statement | | | 53 |
| | |
| | Compensation Discussion and Analysis |
| | | | | | | | | | TSR | | ROCE | | | | Payout Factor | | The TSR payout level will be based on the percentile rank of our three-year average TSR as compared to the performance peer group, as follows: | | The ROCE payout level for the fiscal 2021-2023 awards will be determined as follows: |
| | | | | | | | | | | | | | | Average TSR Percentile Rank Targets | | TSR Payout Factor | | | | Three-Year Average ROCE
Performance | | ROCE Payout Factor* | | | | | less than 25% | | 0.0x | | | | More than 400 bps below target | | 0.0x | | | | | 25% | | 0.5x | | | | 400 bps below target | | 0.5x | | | | | 50% | | 1.0x | | | | At target | | 1.0x | | | | | 90% or more | | 2.0x | | | | 390 bps or more above target | | 2.0x | | |
| * | We consider the ROCE targets for uncompleted performance periods to be confidential financial information, the disclosure of which would result in competitive harm to us because they would reveal information about our growth profile and the effects of anticipated capital expenditures and corporate acquisitions, none of which is otherwise made public. |
Fiscal 2019-2021 Results and Payouts.For fiscal 2019-2021 performance share awards, the following metrics, which were equally weighted, were utilized: TSR relative to a peer group of companies with similar financial and operational characteristics; and ROCE against specific targets over the performance period. Relative TSR (50% weighting).The relative TSR targets and corresponding payout factor for the fiscal 2019-2021 performance share awards were as follows: | | | | | | | | Average TSR
Percentile Rank | | TSR Payout Factor | |
| | | | less than 25% | | 0.0x | | | | | | 25% | | 0.5x | | | | | | 50% | | 1.0x | | | | | | 90% or more | | 2.0x | | | | | | Fiscal Results | |
| | Payout Factor | | | | 2019: | | 88.5% | | | | | | 2020: | | 44.8% | | | | | | 2021: | | 78.5% | | | | | | Average: | | 70.6% | | 1.52x |
ROCE (50% weighting).We designed our ROCE goals for the fiscal 2019-2021 performance share awards to provide 100% payout if the Company achieved an average ROCE of 12.5% over the three-year performance period. The performance targets and associated performance payout for the ROCE metric for the three-year performance period ended August 31, 2021 were as follows: | | | | | | | | ROCE
Performance
Targets | | ROCE Payout
Factor | | | Below 8.7% | | 0.0x | | | 8.7% | | 0.5x | | | 12.5% | | 1.0x | | | 14.8% and above | | 2.0x | | | | | | Fiscal Results | | | | Payout
Factor | 2019: | | 8.04% | | | 2020: | | 2.25% | | | 2021: | | 20.43% | | | Average: | | 10.24% | | 0.70x |
The number of shares issued to each NEO under these awards following vesting on October 31, 2021 is shown in the “Outstanding Equity Awards at Fiscal 2021 Year-End” table. | | | | Notice of Annual Meeting of Shareholders and 2021 Proxy Statement | | | 54 |
| | |
| | Compensation Discussion and Analysis |
Executive Benefits.Our executive benefits are intended, along with base salary, to provide a competitive fixed pay foundation for the work being performed by the executive. NEOs are eligible to participate in benefit plans available tonon-executive employees and to receive additional benefits as described below as part of the compensation package we believe is necessary to attract and retain the desired level of executive talent. Non-Qualified Deferred Compensation Plan.We maintain a non-qualified Deferred Compensation Plan (“DCP”) intended to comply with Section 409A of the Internal Revenue Code that allows certain management level or highly compensated employees of the Company, including the NEOs, to defer receipt of their base salary, bonuses, and performance-based compensation until a date or dates (or until the occurrence of specified events such as a separation from service or change in control) elected by the employee, in accordance with the terms of the plan. See “Fiscal 2021 Non-Qualified Deferred Compensation” for a further description of the DCP and information regarding compensation payable to the NEOs under the DCP. Retirement Plans.We maintain 401(k) plans and a Pension Retirement Plan (the “Pension Plan”) for our employees, including the NEOs. The Pension Plan was “frozen” as of June 30, 2006, and no additional benefits have been accrued for participants since that date. We also maintain a Supplemental Executive Retirement Bonus Plan (“SERBP”) in which the CEO participates. We have not added any participants to the SERBP since 2005. See “Pension Benefits at Fiscal 20182021 Year End” for | | | | | | | Notice of Annual Meeting of Shareholders and 2018 Proxy Statement | | | | 49 | |
| | |
| | Compensation Discussion and Analysis
|
descriptions of the Pension Plan and the SERBP and information regarding benefits payable to the NEOs under the Pension Plan and the SERBP. Change-in-Control Agreements.To ensure that we offer competitive compensation to our NEOs, and to attract and retain top executive talent, we offer severance benefits underchange-in-control agreements as part of our executive compensation packages. The purpose of these agreements is to ensure that we will have the continued attention and dedication of our senior executives during a potential change in control. The Committee believes these agreements are in the best interest of shareholders by providing certainty as to what executives would receive in a change in control, enabling them to remain focused on the business during a period of uncertainty. In April 2008, the Committee approved achange-in-control severance agreement for Messrs. Peach and Dyck.Mr. Peach. In October 2008, the Committee approved an amendedchange-in-control agreement with Ms. Lundgren, which amended and restated herchange-in-control agreement entered into in March 2006. In 2011, the Committee approved a revised form ofchange-in-control agreement, which does not include any taxgross-up provisions, and this form has been used for agreements with Messrs. Henderson, Heiskell and Heiskell.Saba. The specific terms of the change-in-control agreements and the potential benefits payable under the agreements are discussed under “Compensation of Executive Officers – Potential Payments Upon Termination orChange-in-Control” below. At the times the agreements currently in effect were approved, the Committee received advice from Pearl Meyer, and the Company received advice from Willis Towers Watson, that the terms were competitive and consistent with market practices. Indemnity Agreements.Agreements.We have entered into indemnity agreements with each NEO pursuant to which we agree to indemnify such officer in connection with claims or proceedings involving the officer (by reason of serving as a director or officer of the Company or its subsidiaries), as provided in the agreement. Other Benefits.Certain executive officers receive a monthly automobile allowance and use of a Company-provided credit card for fuel purchases. Both amounts are taxable to the executive as compensation income. Certain executive officers also participate in a supplemental executive medical benefits plan which provides full coverage of certain medical and dental expenses (including deductibles andco-payments) not covered by our basic medical and dental plans. Employment Agreements We entered into an employment agreement with our CEO in connection with her initial employment. In October 2008, we entered into an amended and restated employment agreement with our CEO, which became effective on December 1, 2008 in connection with her becoming President and CEO, and which superseded the prior agreement. That agreement was further amended in June 2011 and July 2017. Our CEO’s employment agreement governs the terms and conditions of her employment as CEO through December 1, 2020,2023, provided that on December 1, 2018,2021, and on each December 1 thereafter, the employment agreement automatically extends for an additionalone-year period unless we or our CEO elects not to extend the term. On December 1, 20182021, her employment agreement was automatically extended for an additionalone-year period (i.e., through December 1, 2021)2024). Our CEO’s target bonus of 150% ofyear-end base salary and a maximum bonus payment of 3x target have remained unchanged since May 2011. In the event that our CEO’s employment is terminated by us without cause, including our decision not to extend the term of the employment agreement, or by our CEO for good reason and not under circumstances that would give rise to severance payments to our CEO under herchange-in-control agreement, our CEO would be entitled to receive severance and other benefits as described under “Potential Payments Upon Termination orChange-in-Control.” These benefits were negotiated as part of her original employment agreement in 2005. | | | | Notice of Annual Meeting of Shareholders and 2021 Proxy Statement | | | 55 |
| | |
| | Compensation Discussion and Analysis |
Executive Officer Incentive Compensation Recoupment (“Clawback”) Policy The Company has a written policy to address the recoupment of incentive-based compensation, whether paid in cash or in equity, awarded to or earned by an executive officer whose intentional acts, or failure to act, are responsible in whole, or in part, for the material restatement of the Company’s publicly filed financial statements due to fraud or misconduct, including gross negligence. In the event of such a restatement, the Compensation Committee will determine: (i) the time period involved with, and subsequent periods affected by, any such fraud or misconduct, and (ii) the amount of incentive compensation that should be recouped in each case if such fraud or misconduct is determined to have occurred. | | | | | 50 | | | Notice of Annual Meeting of Shareholders and 2018 Proxy Statement |
| | |
| | Compensation Discussion and Analysis
|
Officer Stock Ownership Policy To promote the long-term alignment of the interests of our officers and shareholders, we adopted the Officer Stock Ownership Policy. The policy requires each of our officers to accumulate ownership of Class A common stock with a value equal to the following multiples of base salary: CEO: 5x; Executive Vice Presidents: 3x; Senior Vice Presidents: 2x; and Vice Presidents: 1x. To reduce the impact of stock price fluctuations on an officer’s ongoing obligation to achieve and maintain compliance with this policy, shares purchased in the open market are valued at cost, shares acquired under RSUs or performance share awards are valued at the market price on vesting, and shares acquired under stock options are valued at the market price at the time of exercise of the option, and these values remain constant. Until the requisite level of ownership is achieved, officers are required to retain at least 50% of the shares (net of shares withheld to cover taxes or sold to cover the option exercise price and taxes) received under RSUs, stock options, and performance share awards. The policy also requires officers who have achieved compliance to thereafter maintain at least the minimum ownership level and to retain 50% of the net shares received thereafter under RSUs, stock options, and performance share awards for at least three years. Ms. Lundgren, Messrs. Peach and Dyck have eachEach of the NEOs has achieved the minimum ownership required, and each of the other NEOs wasexcept for Mr. Saba who is otherwise in compliance with the policy as of August 31, 2018. policy. Tax Deductibility of Executive Compensation Section 162(m) of the Internal Revenue Code (“Section 162(m)”) imposes an annual deduction limit of $1 million on the amount of compensation paid to each of the CEO and certain otherour NEOs. Prior to the enactment of the Tax Cuts and Jobs Act of 2017 (the “TCJA”), the deduction limit did not apply to performance-based compensation satisfying the requirements of Section 162(m). However, the exemption from Section 162(m)’s deduction limit for performance-based compensation has been repealed, effective for the Company’s fiscal 2019 tax year. As a result, compensation paid to our NEOs after fiscal 2018 in excess of $1 million will generally not be deductible unless it qualifies for transition relief applicable to certain binding contracts in place as of November 2, 2017 and which were not materially modified after that date. The policy of the Committee is to structure executive compensation to maximize the deductibility of compensation where feasible consistent with our overall compensation objectives. Preserving deductibility is not the only goal for the Company’s executive compensation program, however, and the Committee retains the discretion to award compensation that is nondeductible.
| | | | | | | Notice of Annual Meeting of Shareholders and 20182021 Proxy Statement | | | | 51 | 56 |
Compensation Committee Report The Compensation Committee has: Reviewed and discussed the above section titled “Compensation Discussion and Analysis” with management; and Based on the review and discussion above, recommended to the Board that the “Compensation Discussion and Analysis” section be included in this proxy statement. COMPENSATION COMMITTEE Judith A. Johansen, Chair Wayland R. Hicks Rhonda D. Hunter David L. Jahnke Michael W. Sutherlin | | | | | 52 | | | Notice of Annual Meeting of Shareholders and 20182021 Proxy Statement | | | 57 |
Compensation of Executive Officers Summary Compensation Table The following table sets forth certain information concerning compensation of the NEOs during the fiscal years ended August 31, 2016, 2017,2019, 2020, and 2018.2021. | | | | | | | | | | | | | | | | | | | | | | | | | | | | | | | | | | | | Name and Principal Position | | Year | | Salary ($) | | Stock Awards ($)(1) | | Non-Equity Incentive
Plan Compensation ($)(2) | | Change in Pension
Value and Nonqualified Deferred Compensation Earnings ($)(3) | | All Other Compensation ($)(4) | | Total ($) | Tamara L. Lundgren President and Chief Executive Officer | | | | 2018 | | | | | 1,104,231 | | | | | 3,499,941 | | | | | 4,290,000 | | | | | 110,184 | | | | | 84,179 | | | | | 9,088,535 | | | | | | 2017 | | | | | 1,014,615 | | | | | 3,499,930 | | | | | 4,025,309 | | | | | 244,373 | | | | | 54,212 | | | | | 8,838,439 | | | | | | 2016 | | | | | 1,000,000 | | | | | 4,299,969 | | | | | 1,519,570 | | | | | 218,051 | | | | | 32,963 | | | | | 7,070,553 | | Richard D. Peach Senior Vice President, Chief Financial Officer and Chief of Corporate Operations | | | | 2018 | | | | | 663,904 | | | | | 959,982 | | | | | 1,097,005 | | | | | — | | | | | 24,436 | | | | | 2,745,327 | | | | | | 2017 | | | | | 634,108 | | | | | 959,932 | | | | | 831,823 | | | | | — | | | | | 24,213 | | | | | 2,450,076 | | | | | | 2016 | | | | | 618,000 | | | | | 959,935 | | | | | 451,410 | | | | | — | | | | | 30,622 | | | | | 2,059,967 | | | | | | | | | | | | | | | | | | | | | | | | | | | | | | | | | | | | | | Michael R. Henderson Senior Vice President and Co-President, AMR and CSS | | | | 2018 | | | | | 564,404 | | | | | 749,947 | | | | | 932,601 | | | | | — | | | | | 24,459 | | | | | 2,271,411 | | | | | | 2017 | | | | | 539,365 | | | | | 749,921 | | | | | 702,064 | | | | | — | | | | | 25,022 | | | | | 2,016,372 | | | �� | | | 2016 | | | | | 525,000 | | | | | 749,955 | | | | | 349,669 | | | | | — | | | | | 43,981 | | | | | 1,668,605 | | Steven G. Heiskell Senior Vice President and Co-President, AMR | | | | 2018 | | | | | 482,305 | | | | | 749,947 | | | | | 622,204 | | | | | — | | | | | 13,403 | | | | | 1,867,859 | | | | | | 2017 | | | | | 460,861 | | | | | 749,921 | | | | | 524,174 | | | | | — | | | | | 13,060 | | | | | 1,748,016 | | | | | | 2016 | | | | | 438,462 | | | | | 749,955 | | | | | 259,754 | | | | | — | | | | | 12,972 | | | | | 1,461,143 | | Jeffrey Dyck(5) Senior Vice President and Co-President, CSS | | | | 2018 | | | | | 464,135 | | | | | 514,979 | | | | | 582,516 | | | | | — | | | | | 23,386 | | | | | 1,585,016 | | | | | | 2016 | | | | | 433,000 | | | | | 514,947 | | | | | 217,160 | | | | | — | | | | | 22,053 | | | | | 1,187,160 | | | | | | | | | | | | | | | | | | | | | | | | | | | | | | | | | | | | | |
| | | | | | | | | | | | | | | | | | | | | | | | | | | | | | | | | | | | | | | | | | | | | | | | | | | Name and Principal Position | | Year | | Salary ($) | | Bonus ($) | | Stock Awards ($)(1) | | Non-Equity Incentive Plan Compensation
Earnings ($)(2) | | Change in Pension Value and Nonqualified Deferred Compensation Earnings ($)(3) | | All Other Compensation ($)(4) | | Total ($) | Tamara L. Lundgren | | | | 2021 | | | | | 1,193,530 | | | | | — | | | | | 3,785,214 | | | | | 4,972,303 | | | | | 132,671 | | | | | 65,745 | | | | | 10,149,463 | | Chairman, President and | | | | 2020 | | | | | 1,160,780 | | | | | — | | | | | 3,604,973 | | | | | 1,681,644 | | | | | 343,706 | | | | | 80,451 | | | | | 6,871,554 | | Chief Executive Officer | | | | 2019 | | | | | 1,127,669 | | | | | — | | | | | 3,604,973 | | | | | 790,268 | | | | | 324,943 | | | | | 82,279 | | | | | 5,930,132 | | | | | | | | | | | | | | | | | | | | | | | | | | | | | | | | | | | | | | | | | | | Richard D. Peach | | | | | | | | | | | | | | | | | | | | | | | | | | | | | | | | | | | | | | | | | Executive Vice President, | | | | 2021 | | | | | 737,766 | | | | | — | | | | | 1,007,950 | | | | | 1,380,719 | | | | | — | | | | | 15,373 | | | | | 3,141,808 | | Chief Financial Officer & | | | | 2020 | | | | | 716,243 | | | | | — | | | | | 959,975 | | | | | 570,516 | | | | | — | | | | | 28,144 | | | | | 2,274,878 | | Chief Strategy Officer | | | | 2019 | | | | | 694,578 | | | | | 52,064 | | | | | 959,968 | | | | | 260,207 | | | | | — | | | | | 25,935 | | | | | 1,992,752 | | | | | | | | | | | | | | | | | | | | | | | | | | | | | | | | | | | | | | | | | | | Michael R. Henderson | | | | 2021 | | | | | 637,322 | | | | | — | | | | | 787,474 | | | | | 1,192,740 | | | | | — | | | | | 14,835 | | | | | 2,632,371 | | Senior Vice President and | | | | 2020 | | | | | 618,729 | | | | | — | | | | | 749,975 | | | | | 492,842 | | | | | — | | | | | 27,886 | | | | | 1,889,432 | | President, Operations | | | | 2019 | | | | | 598,423 | | | | | 44,181 | | | | | 749,974 | | | | | 224,781 | | | | | — | | | | | 26,269 | | | | | 1,643,628 | | | | | | | | | | | | | | | | | | | | | | | | | | | | | | | | | | | | | | | | | | | Steven G. Heiskell | | | | 2021 | | | | | 558,602 | | | | | — | | | | | 787,474 | | | | | 1,044,826 | | | | | — | | | | | 14,412 | | | | | 2,405,314 | | Senior Vice President and | | | | 2020 | | | | | 542,268 | | | | | — | | | | | 749,975 | | | | | 431,731 | | | | | — | | | | | 14,323 | | | | | 1,738,297 | | President, Products & Services | | | | 2019 | | | | | 521,474 | | | | | 44,263 | | | | | 749,974 | | | | | 182,904 | | | | | — | | | | | 14,562 | | | | | 1,513,177 | | | | | | | | | | | | | | | | | | | | | | | | | | | | | | | | | | | | | | | | | | | Peter B. Saba | | | | 2021 | | | | | 526,712 | | | | | — | | | | | 524,968 | | | | | 739,302 | | | | | — | | | | | 14,239 | | | | | 1,805,221 | | Senior Vice President, General Counsel & Corporate Secretary | | | | | | | | | | | | | | | | | | | | | | | | | | | | | | | | | | | | | | | | |
| (1) | Represents the aggregate grant date fair value of stock awards granted during each of the years computed in accordance with FASB ASC Topic 718. These amounts reflect the grant date fair value and may not correspond to the actual value that will be realized by the NEOs. Stock awards consist of RSUs and LTIP performance shares. The grant date fair value of the RSUs is equal to the value of the underlying shares based on the closing market price of the Company’s Class A common stock on the NasdaqNASDAQ Global Select Market on the grant date. The grant date fair value of the LTIP performance share awards under the CFROI and ROCE metricsmetric is calculated by multiplying the target number of shares issuable under the award by the closing market price of the Company’s Class A common stock on the NasdaqNASDAQ Global Select Market on the grant date. The grant date fair value of the LTIP performance share awards under the TSR metric is estimated using a Monte-Carlo simulation model. The assumptions made in determining the values of the LTIP performance shares are disclosed in Note 13 of the Consolidated Financial Statements in our Annual Report on Form 10-K for fiscal 2021. If the maximum number of shares issuable under LTIP performance share awards had been used in this calculation in lieu of the target number of shares, the amounts in the table for fiscal 20182021 would have been: Ms. Lundgren, $5,249,894;$5,677,816; Mr. Peach, $1,439,967;$1,511,911; Mr. Henderson, $1,124,914;$1,181,213; Mr. Heiskell, $1,124,914;$1,181,213; and Mr. Dyck, $772,470.Saba, $787,446. |
| (2) | Non-Equity Incentive Plan Compensation in fiscal 20182021 consists of amounts paid under the AICP and the APBP. See “Compensation Discussion and Analysis – Annual Incentive Programs.” |
| (3) | Represents changes in the actuarial present value of accumulated benefits under the Pension Retirement Plan and the SERBP for each of the years presented using the same pension plan measurement date used for financial statement reporting purposes. |
| (4) | Includes for fiscal 2018,2021, Company matching contributions of $10,800$11,400 to the account of each NEO under the 401(k) Plan. Includes for fiscal 2018,2021, amounts paid forout-of-pocket medical expenses under the supplemental executive medical benefits plan to Ms. Lundgren of $58,001.$48,936. Includes for fiscal 2018,2021, premiums paid for life, disability and other insurance in the following amounts: Ms. Lundgren, $5,409; Mr. Peach, $3,582;$3,973; Mr. Henderson, $3,047;$3,435; Mr. Heiskell, $2,603;$3,012; and Mr. Dyck, $2,507. Includes for fiscal 2018, automobile allowance and fuel purchase fringe benefits in the following amounts: Ms. Lundgren, $9,969; Mr. Peach, $10,054; Mr. Henderson, $10,613; and Mr. Dyck, $10,079. |
(5) | Mr. Dyck was not a named executive officer in fiscal 2017.Saba, $2,839.
|
| | | | | | | Notice of Annual Meeting of Shareholders and 20182021 Proxy Statement | | | | 53 | 58 |
| | |
| | Compensation of Executive Officers |
Grants of Plan-Based Awards in Fiscal 20182021 | | | | | | | | | | | | | | | | | | | | | | | | | Estimated Possible Payouts Under Non-Equity Incentive Plan Awards(1) | | | | Estimated Future Payouts Under Equity Incentive Plan Awards(2) | | | All Other Stock Awards: Shares Stock or Units (#)(3) | | Grant Date Fair Value of Stock Awards ($)(4) | | | Name | | Grant Date | | | Estimated Possible Payouts Under
Non-Equity Incentive Plan
Awards(1) | | | Estimated Future Payouts Under
Equity Incentive Plan
Awards(2) | | | All Other
Stock
Awards:
Number of
Shares of
Stock or
Units
(#)(3) | | | Grant Date Fair Value of Stock Awards
($)(4) | | | Grant Date | | Threshold ($) | | Target ($) | | Maximum ($) | | | | Threshold ($) | | Target ($) | | Maximum ($) | | | | Threshold ($) | | | Target ($) | | | Maximum ($) | | | Threshold (#) | | | Target (#) | | | Maximum (#) | | | Tamara L. Lundgren | | | 11/14/2017 | | | | | | | | | | 32,027 | | | | 64,054 | | | | 128,108 | | | | 65,789 | | | | 3,499,941 | | | | 11/9/2020 | | | | 946,301 | | | | 1,892,602 | | | | 3,785,204 | | | | 1,892,602 | | | | | | | — | | | | 1,650,000 | | | | 4,950,000 | | | | | | | | | | | | | | | | | 11/9/2020 | | | | 85,023 | | | | 1,892,612 | | | | | | | | — | | | | 1,782,188 | | | | 5,346,563 | | | | | | | | | | | | | | Richard D. Peach | | | 11/14/2017 | | | | | | | | | | 8,785 | | | | 17,569 | | | | 35,138 | | | | 18,045 | | | | 959,982 | | | | 11/9/2020 | | | | 251,981 | | | | 503,961 | | | | 1,007,922 | | | | 503,961 | | | | | | 11/9/2020 | | | | 22,641 | | | | 503,989 | | | | | | | | 165,212 | | | | 660,846 | | | | 1,321,693 | | | | | | | | | | | | | | | | 183,606 | | | | 734,425 | | | | 1,468,850 | | | | | | | | | | | | | | Michael R. Henderson | | | 11/14/2017 | | | | | | | | | | 6,863 | | | | 13,725 | | | | 27,450 | | | | 14,097 | | | | 749,947 | | | | 11/9/2020 | | | | 196,870 | | | | 393,739 | | | | 787,479 | | | | 393,739 | | | | | | | 140,452 | | | | 561,808 | | | | 1,123,615 | | | | | | | | | | | | | | 11/9/2020 | | | | 17,688 | | | | 393,735 | | | | | | | | 158,609 | | | | 634,436 | | | | 1,268,872 | | | | | | | | | | | | | | Steven G. Heiskell | | | 11/14/2017 | | | | | | | | | | 6,863 | | | | 13,725 | | | | 27,450 | | | | 14,097 | | | | 749,947 | | | | 11/9/2020 | | | | 196,870 | | | | 393,739 | | | | 787,479 | | | | 393,739 | | | | | | | | 93,705 | | | | 374,822 | | | | 749,643 | | | | | | | | | | | | | | 11/9/2020 | | | | 17,688 | | | | 393,735 | | Jeffrey Dyck | | | 11/14/2017 | | | | | | | | | | 4,713 | | | | 9,425 | | | | 18,850 | | | | 9,680 | | | | 514,979 | | | | | | | | 87,728 | | | | 350,914 | | | | 701,827 | | | | | | | | | | | | | | | | | | | 138,940 | | | | 555,758 | | | | 1,111,516 | | | | | | | | | | | | | | Peter B. Saba | | | | 11/9/2020 | | | | 131,239 | | | | 262,478 | | | | 524,956 | | | | 262,478 | | | | | | 11/9/2020 | | | | 11,792 | | | | 262,490 | | | | | | | 98,311 | | | | 393,245 | | | | 786,490 | | |
| (1) | All amounts reported in these columns represent the potential incentive plan payable for performance in fiscal 20182021 under the Company’s AICP or the APBP under the CEO’s employment agreement. The Committee annually approves target incentive plan levels as a percentage of either base salary as of the end of the fiscal year (for the CEO) or base salary actually paid during the fiscal year (for the other NEOs). The total target bonus percentage for Ms. Lundgren under the APBP wasremained unchanged for fiscal 2021 at 150%. TheFor fiscal 2021, the target bonus percentages for all other NEOs under the AICP increased for fiscal 2018Messrs. Peach, Henderson, and Heiskell remained unchanged at 100% and remained unchanged for Mr. Peach and Mr. Henderson, 80% to 100%; Mr. Heiskell, 70% to 80%; and for Mr. Dyck, 65% toSaba at 75%. For Messrs. Peach, Henderson, Heiskell and Dyck,Saba, the Committee retained discretion to pay bonuses below the stated threshold and above the stated maximum amounts. See “Compensation Discussion and Analysis – Annual Incentive Programs.” Bonus amounts earned based on fiscal 20182021 performance are included under theNon-Equity Incentive Plan Compensation column in the “Summary Compensation Table.” |
| (2) | All amounts reported in these columns represent LTIP performance share awards granted in fiscal 20182021 under the Company’s respective LTIP award agreements and the potential incentive plan payable based on performance during fiscal years 2018, 20192021, 2022 and 2020.2023. See “Compensation Discussion and Analysis – Long Term Incentive Program.” |
| (3) | Represents RSUs granted in fiscal 20182021 under the Company’s SIP. RSUs vest ratably over five years, subject to continued employment. Vesting may be accelerated in certain circumstances, as described under “Potential Payments Upon Termination or Change in Control.” |
| (4) | Represents the aggregate grant date fair value of RSUs and LTIP performance share awards computed in accordance with FASB ASC Topic 718. The grant date fair value of the RSUs is equal to the value of the underlying restricted shares based on the closing market price of the Company’s Class A common stock on the NasdaqNASDAQ Global Select Market on the grant date. The grant date fair value of the LTIP performance share awards under the ROCE metric is calculated by multiplying the target number of shares issuable under the award by the closing market price of the Company’s Class A common stock on the NasdaqNASDAQ Global Select Market on the grant date. The grant date fair value of the LTIP performance share awards under the TSR metric is estimated using a Monte-Carlo simulation model. |
Narrative Disclosure to Summary Compensation Table and Grants of Plan-Based Awards in Fiscal 20182021 We entered into an employment agreement with our CEO in connection with her initial employment. See “Compensation Discussion and Analysis – Employment Agreements” above for a description of the material terms of her employment agreement. | | | | | 54 | | | Notice of Annual Meeting of Shareholders and 20182021 Proxy Statement | | | 59 |
| | |
| | Compensation of Executive Officers |
Outstanding Equity Awards at Fiscal 20182021 Year End The following table sets forth certain information concerning outstanding equity awards for each NEO as of August 31, 2018.2021. | | | | | | Stock Awards | | | | | | | | | | | | | | | | | | | | | Number
of Shares or
Units of Stock
That Have Not
Vested | | Market Value of
Shares or
Units of Stock
That Have Not
Vested | | | Equity Incentive
Plan Awards:
Number of
Unearned Shares,
Units or Other
Rights That
Have Not Vested | | Equity Incentive
Plan Awards:
Market or Payout
Value of Unearned
Shares, Units or
Other Rights That
Have Not Vested | | | | | Stock Awards | | | Name | | Number
of Shares
or Units
of Stock
That Have
Not
Vested (#)(1) | | Market
Value of
Shares or
Units of
Stock That
Have Not
Vested
($)(2) | | Equity Incentive Plan Awards: Number of Unearned Shares, Units or Other Rights That Have Not Vested (#) | | Equity Incentive
Plan Awards:
Market or Payout
Value of Unearned
Shares, Units or
Other Rights That
Have Not Vested ($)(2) | | (#)(1) | | ($)(2) | | | (#) | | ($)(2) | | | Tamara L. Lundgren | | | 11,457 | (3) | | | 301,892 | | | | — | | | | — | | | | 7,431 | (3) | | | 351,561 | | | | — | | | | — | | | | | | | 9,309 | (4) | | | 440,409 | | | | — | | | | — | | | | | | | 26,316 | (4) | | | 1,245,010 | | | | — | | | | — | | | | | | | 39,171 | (5) | | | 1,853,180 | | | | — | | | | — | | | | | 30,448 | (4) | | | 802,305 | | | | — | | | | — | | | | | | 31,476 | (5) | | | 829,393 | | | | — | | | | — | | | | 96,908 | (6) | | | 4,584,717 | | | | — | | | | — | | | | | 25,180 | (5) | | | 663,493 | | | | — | | | | — | | | | | | 29,724 | (6) | | | 783,227 | | | | — | | | | — | | | | 85,023 | (7) | | | 4,022,438 | | | | — | | | | — | | | | | 37,234 | (6) | | | 981,116 | | | | — | | | | — | | | | | | 65,789 | (7) | | | 1,733,540 | | | | — | | | | — | | | | — | | | | — | | | | 63,538 | (8) | | | 3,005,983 | | | | | — | | | | — | | | | 76,634 | (8) | | | 2,019,306 | | | | | | — | | | | — | | | | 60,595 | (9) | | | 1,596,678 | | | | — | | | | — | | | | 159,556 | (9) | | | 7,548,594 | | | | | — | | | | — | | | | 58,196 | (10) | | | 1,533,465 | | | | | | — | | | | — | | | | 83,657 | (11) | | | 2,204,362 | | | | — | | | | — | | | | 169,476 | (10) | | | 8,017,910 | | | | | — | | | | — | | | | 118,448 | (12) | | | 3,121,105 | | | Richard D. Peach | | | 3,143 | (3) | | | 82,818 | | | | — | | | | — | | | | 2,039 | (3) | | | 96,465 | | | | — | | | | — | | | | | 8,352 | (4) | | | 220,075 | | | | — | | | | — | | | | | | 8,634 | (5) | | | 227,506 | | | | — | | | | — | | | | 2,553 | (4) | | | 120,782 | | | | — | | | | — | | | | | 6,906 | (5) | | | 181,973 | | | | — | | | | — | | | | | | 8,153 | (6) | | | 214,832 | | | | — | | | | — | | | | 7,218 | (4) | | | 341,484 | | | | — | | | | — | | | | | 10,212 | (6) | | | 269,086 | | | | — | | | | — | | | | | | 18,045 | (7) | | | 475,486 | | | | — | | | | — | | | | 10,431 | (5) | | | 493,491 | | | | — | | | | — | | | | | — | | | | — | | | | 21,018 | (8) | | | 553,824 | | | | | | — | | | | — | | | | 16,619 | (9) | | | 437,911 | | | | 25,807 | (6) | | | 1,220,929 | | | | — | | | | — | | | | | — | | | | — | | | | 15,960 | (10) | | | 420,546 | | | | | | — | | | | — | | | | 22,944 | (11) | | | 604,574 | | | | 22,641 | (7) | | | 1,071,146 | | | | — | | | | — | | | | | — | | | | — | | | | 32,488 | (12) | | | 856,059 | | | | | | | — | | | | — | | | | 16,919 | (8) | | | 800,438 | | | | | | | — | | | | — | | | | 42,487 | (9) | | | 2,010,060 | | | | | | | | — | | | | — | | | | 45,128 | (10) | | | 2,135,006 | | | Michael R. Henderson | | | 2,046 | (3) | | | 53,912 | | | | — | | | | — | | | | 1,593 | (3) | | | 75,365 | | | | — | | | | — | | | | | 6,525 | (4) | | | 171,934 | | | | — | | | | — | | | | | | 6,745 | (5) | | | 177,731 | | | | — | | | | — | | | | 1,995 | (4) | | | 94,383 | | | | — | | | | — | | | | | 5,396 | (5) | | | 142,185 | | | | — | | | | — | | | | | | 6,369 | (6) | | | 167,823 | | | | — | | | | — | | | | 5,640 | (4) | | | 266,828 | | | | — | | | | — | | | | | 7,979 | (6) | | | 210,247 | | | | — | | | | — | | | | | | 14,097 | (7) | | | 371,456 | | | | — | | | | — | | | | 8,150 | (5) | | | 385,577 | | | | — | | | | — | | | | | — | | | | — | | | | 16,420 | (8) | | | 432,667 | | | | | | — | | | | — | | | | 12,983 | (9) | | | 342,102 | | | | 20,161 | (6) | | | 953,817 | | | | — | | | | — | | | | | — | | | | — | | | | 12,468 | (10) | | | 328,532 | | | | | | — | | | | — | | | | 17,925 | (11) | | | 472,324 | | | | 17,688 | (7) | | | 836,819 | | | | — | | | | — | | | | | — | | | | — | | | | 25,380 | (12) | | | 668,763 | | | | | | | — | | | | — | | | | 13,218 | (8) | | | 625,344 | | | | | | | — | | | | — | | | | 33,193 | (9) | | | 1,570,361 | | | | | | | | — | | | | — | | | | 35,258 | (10) | | | 1,668,056 | | | Steven G. Heiskell | | | | 1,593 | (3) | | | 75,365 | | | | — | | | | — | | | | | | | 1,995 | (4) | | | 94,383 | | | | — | | | | — | | | | | | | 5,640 | (4) | | | 266,828 | | | | — | | | | — | | | | | | | 8,150 | (5) | | | 385,577 | | | | — | | | | — | | | | | | | 20,161 | (6) | | | 953,817 | | | | — | | | | — | | | | | | | 17,688 | (7) | | | 836,819 | | | | — | | | | — | | | | | | | — | | | | — | | | | 13,218 | (8) | | | 625,344 | | | | | | | — | | | | — | | | | 33,193 | (9) | | | 1,570,361 | | | | | | | | — | | | | — | | | | 35,258 | (10) | | | 1,668,056 | |
| | | | | | | Notice of Annual Meeting of Shareholders and 20182021 Proxy Statement | | | | 55 | 60 |
| | |
| | Compensation of Executive Officers |
| | | | | | | | | | | | | | | | | | | | | | | | Stock Awards | | Name | | Number
of Shares
or Units
of Stock
That Have
Not
Vested (#)(1) | | Market
Value of
Shares or
Units of
Stock That
Have Not
Vested
($)(2) | | Equity Incentive Plan Awards: Number of Unearned Shares, Units or Other Rights That Have Not Vested (#) | | Equity Incentive
Plan Awards:
Market or Payout
Value of Unearned
Shares, Units or
Other Rights That
Have Not Vested ($)(2) | Steven G. Heiskell | | | | 819 | (3) | | | | 21,581 | | | | | — | | | | | — | | | | | | 2,176 | (4) | | | | 57,338 | | | | | — | | | | | — | | | | | | 6,745 | (5) | | | | 177,731 | | | | | — | | | | | — | | | | | | 5,396 | (5) | | | | 142,185 | | | | | — | | | | | — | | | | | | 6,369 | (6) | | | | 167,823 | | | | | — | | | | | — | | | | | | 7,979 | (6) | | | | 210,247 | | | | | — | | | | | — | | | | | | 14,097 | (7) | | | | 371,456 | | | | | — | | | | | — | | | | | | — | | | | | — | | | | | 16,420 | (8) | | | | 432,667 | | | | | | — | | | | | — | | | | | 12,983 | (9) | | | | 342,102 | | | | | | — | | | | | — | | | | | 12,468 | (10) | | | | 328,532 | | | | | | — | | | | | — | | | | | 17,925 | (11) | | | | 472,324 | | | | | | — | | | | | — | | | | | 25,380 | (12) | | | | 668,763 | | Jeffrey Dyck | | | | 1,349 | (3) | | | | 35,546 | | | | | — | | | | | — | | | | | | 4,480 | (4) | | | | 118,048 | | | | | — | | | | | — | | | | | | 4,632 | (5) | | | | 122,053 | | | | | — | | | | | — | | | | | | 3,705 | (5) | | | | 97,627 | | | | | — | | | | | — | | | | | | 4,374 | (6) | | | | 115,255 | | | | | — | | | | | — | | | | | | 5,479 | (6) | | | | 144,372 | | | | | — | | | | | — | | | | | | 9,680 | (7) | | | | 255,068 | | | | | — | | | | | — | | | | | | — | | | | | — | | | | | 11,274 | (8) | | | | 297,070 | | | | | | — | | | | | — | | | | | 8,914 | (9) | | | | 234,884 | | | | | | — | | | | | — | | | | | 8,562 | (10) | | | | 225,609 | | | | | | — | | | | | — | | | | | 12,308 | (11) | | | | 324,316 | | | | | | — | | | | | — | | | | | 17,428 | (12) | | | | 459,228 | |
| | | | | | | | | | | | | | | | | | | | | | Stock Awards | | | | | | | | | | Number
of Shares or
Units of Stock
That Have Not
Vested | | | Market Value of
Shares or
Units of Stock
That Have Not
Vested | | | Equity Incentive
Plan Awards:
Number of
Unearned Shares,
Units or Other
Rights That
Have Not Vested | | | Equity Incentive
Plan Awards:
Market or Payout
Value of Unearned
Shares, Units or
Other Rights That
Have Not Vested | | | | | | | | Name | | (#)(1) | | | ($)(2) | | | (#) | | | ($)(2) | | | | | | | Peter B. Saba | | | 1,062 | (3) | | | 50,243 | | | | — | | | | — | | | | | | | | | | 1,330 | (4) | | | 62,922 | | | | — | | | | — | | | | | | | | | | 3,760 | (4) | | | 177,886 | | | | — | | | | — | | | | | | | | | | 5,433 | (5) | | | 257,035 | | | | — | | | | — | | | | | | | | | | 13,441 | (6) | | | 635,894 | | | | — | | | | — | | | | | | | | | | 11,792 | (7) | | | 557,880 | | | | — | | | | — | | | | | | | | | | — | | | | — | | | | 8,812 | (8) | | | 416,896 | | | | | | | | | | — | | | | — | | | | 22,127 | (9) | | | 1,046,828 | | | | | | | | | | | — | | | | — | | | | 23,504 | (10) | | | 1,111,974 | |
| (1) | ReflectsFor RSU awards granted prior to fiscal 2020 and in fiscal 2021, reflects RSUs that vest for 20% of the shares on October 31 of the year following the grant date and on October 31 of each of the next four years thereafter except as otherwise described below, becoming fully vested on the fifth October 31 of the year following the grant date, subject to continued employment and accelerated vesting under certain circumstances. For RSU awards granted during fiscal 2020, reflects RSUs that vest for 20% of the shares on April 30 of the year following the grant date and on April 30 of each of the next four years thereafter, becoming fully vested on the fifth April 30 of the year following the grant date, subject to continued employment and accelerated vesting under certain circumstances.
|
| (2) | Market values of all shares are based on the closing market price of the Company’s Class A common stock on the NasdaqNASDAQ Global Select Market on the last trading day of fiscal 2018.2021. |
| (3) | This RSU award fully vested on October 31, 2018.2021. |
| (4) | This RSU award vests as to 50% of the shares on October 31 each year in 20182021 and 2019.2022. |
| (5) | This RSU award vests as to 33% of the shares on October 31 each year in 2018, 2019,2021, 2022, and 2020.2023. |
| (6) | This RSU award vests as to 25% of the shares on April 30 each year in 2022, 2023, 2024, and 2025. |
| (7) | This RSU award vests as to 25% of the shares on October 31 each year in 2018, 2019, 2020,2021, 2022, 2023, and 2021. |
(7) | This RSU vests as to 20% of the shares on October 31 each year in 2018, 2019, 2020, 2021, and 2022.2024.
|
| (8) | Reflects LTIP performance shares under awards granted in the first quarter of fiscal 20162019 that were subject to performance over the three-year performance period of fiscal 20162019 through fiscal 2018.2021. Vesting of these shares was also subject to continued employment until October 31, 2018.2021. Share amounts in the table represent the number issuable based on actual performance through fiscal 2018.2021. |
| (9) | Reflects LTIP performance shares under awards granted in the thirdfirst quarter of fiscal 20162020 that wereare subject to performance over the 21/2-yearthree-year performance period of the second half of fiscal 20162020 through fiscal 2018.2022. Vesting of these shares wasis also subject to continued employment until October 31, 2018.2022. Share amounts in the table represent the number issuable based on actual performance through fiscal 2018.2021 and maximum level of performance in the remainder of the performance period. |
| (10) | Reflects LTIP performance shares under awards granted in the first quarter of fiscal 20172021 that are subject to performance over the three-year performance period of fiscal 20172021 through fiscal 2019.2023. Vesting of these shares is also subject to continued employment until October 31, 2019.2023. Share amounts in the table represent the number issuable based on actual performance through fiscal 20182021 and maximum level of performance in the remainder of the performance period. |
(11) | Reflects LTIP performance shares under awards granted in the third quarter of fiscal 2017 that are subject to performance over the 21/2-year performance period of the second half of fiscal 2017 through fiscal 2019. Vesting of these shares is also subject to continued employment until October 31, 2019. Share amounts in the table represent the number issuable based on actual performance through fiscal 2018 and maximum level of performance in the remainder of the performance period.
|
(12) | Reflects LTIP performance shares under awards granted in the first quarter of fiscal 2018 that are subject to performance over the three-year performance period of fiscal 2018 through fiscal 2020. Vesting of these shares is also subject to continued employment until October 31, 2020. Share amounts in the table represent the number issuable based on actual performance through fiscal 2018 and maximum level of performance in the remainder of the performance period.
|
| | | | | 56 | | | Notice of Annual Meeting of Shareholders and 2018 Proxy Statement |
| | |
| | Compensation of Executive Officers
|
Stock Vested in Fiscal 20182021 The following table sets forth certain information concerning vesting of stock for each NEO during the fiscal year ended August 31, 2018.2021. | | | | | | | | | | | | Stock Awards | | | | Stock Awards | | | Name | | Number of Shares Acquired on Vesting (#) | | Value Realized on Vesting ($)(1) | | Number of Shares Acquired on Vesting (#) | | Value Realized on Vesting ($)(1) | Tamara L. Lundgren | | | 86,384 | | | | 2,544,009 | | | | 175,121 | | | | 4,312,540 | | Richard D. Peach | | | 17,088 | | | | 503,242 | | | | 47,734 | | | | 1,171,489 | | Michael R. Henderson | | | 12,940 | | | | 381,083 | | | | 37,291 | | | | 915,219 | | Steven G. Heiskell | | | 9,537 | | | | 280,865 | | | | 37,291 | | | | 915,219 | | Jeffrey Dyck | | | 8,829 | | | | 260,014 | | | Peter B. Saba | | | | 24,323 | | | | 598,854 | |
| (1) | The value realized on vesting is based on the closing market price of the Company’s Class A common stock on the NasdaqNASDAQ Global Select Market on the vesting date. |
| | | | Notice of Annual Meeting of Shareholders and 2021 Proxy Statement | | | 61 |
| | |
| | Compensation of Executive Officers |
Pension Benefits at Fiscal 20182021 Year End The following table sets forth certain information concerning accrued pension benefits for each NEO as of August 31, 2018.2021. | | | | | | | | | | | | | | | | | | | | | | | Name | | Age | | Plan Name | | Number of Years of
Credited Service
| | Present Value of
Accumulated Benefit
($)(1)(2)
| | Payments During
Last Fiscal Year
($)
| Tamara L. Lundgren
| | | | 61
| | | Pension Retirement Plan Suppl.
Exec. Retirement Bonus Plan
| | |
| 13
13
|
| | |
| 55,751
1,430,652
|
| | |
| —
—
|
| Richard D. Peach
| | | | 55 | | | Pension Retirement Plan
| | | | — | | | | | — | | | | | — | | Michael R. Henderson
| | | | 59 | | | Pension Retirement Plan
| | | | — | | | | | — | | | | | — | | Steven G. Heiskell
| | | | 49 | | | Pension Retirement Plan
| | | | — | | | | | — | | | | | — | | Jeffrey Dyck
| | | | 55 | | | Pension Retirement Plan
| | | | — | | | | | — | | | | | — | |
| | | | | | | | | | | | | | | | | | | Name | | Age | | Plan Name | | Number of Years of Credited Service | | Present Value of Accumulated Benefit ($)(1)(2) | | | Payments During Last Fiscal Year ($) | Tamara L. Lundgren | | 64 | | Pension Retirement Plan | | 16 | | | 132,671 | | | — | | | | | Suppl. Exec. Retirement Bonus Plan | | 16 | | | 2,287,723 | | | — | Richard D. Peach | | 58 | | Pension Retirement Plan | | — | | | — | | | — | Michael R. Henderson | | 62 | | Pension Retirement Plan | | — | | | — | | | — | Steven G. Heiskell | | 52 | | Pension Retirement Plan | | — | | | — | | | — | Peter B. Saba | | 60 | | Pension Retirement Plan | | — | | | — | | | — |
| (1) | The Pension Retirement Plan Present Value of Accumulated Benefit in the above table represents the actuarial present value as of August 31, 20182021 of each NEO’s frozen pension benefit, assuming commencement of benefit payments at age 65. Benefit accruals under that plan ceased when the plan was frozen on June 30, 2006, but years of service are still relevant for purposes of satisfying the five-year vesting requirement. The SERBP Present Value of Accumulated Benefit in the table above represents the actuarial present value as of August 31, 20182021 of the CEO’s pension benefit calculated based on years of credited service and the maximum SERBP benefit level as of that date and assuming commencement of benefit payments one year from the determination date. Actuarial present values were calculated using a discount rate of 3.97%2.51% with respect to the Pension Retirement Plan and 3.89%2.36% with respect to the SERBP, and theRP-2014 PRI 2012 generational mortality tables with mortality improvement scale white collar MP-2017,MP-2020, the same assumptions used in the pension benefit calculations reflected in the Company’s audited consolidated balance sheet for the year ended August 31, 2018.2021. See “Compensation Discussion and Analysis – ElementsStructure of Compensation Program – Executive Benefits – Retirement Plans.” |
| (2) | Ms. Lundgren is eligible to commence benefits under the Supplemental Executive Retirement Bonus Plan once her employment ends. If she had retired on August 31, 20182021 and begun receiving benefit payments, the present value of accumulated benefits for her as reflected in the above table for that plan would have been higher by $112,775.$170,379. |
Fiscal 2021 Non-Qualified Deferred Compensation The Company’s Deferred Compensation Plan is a non-qualified plan intended to comply with Section 409A of the Internal Revenue Code that allows certain management level or highly compensated employees of the Company, including the NEOs, to defer receipt of their base salary, bonuses and performance-based compensation until a date or dates (or until the occurrence of specified events such as a separation from service or change in control) elected by the employee, in accordance with the terms of the plan. Deferral elections are generally irrevocable, subject to limited exceptions as permitted under Section 409A of the Internal Revenue Code. The Deferred Compensation Plan also permits the Company to make discretionary awards of additional deferred compensation amounts which may be subject to vesting terms as determined by the Company in its discretion. Deferrals may be allocated by participants among hypothetical investment options presented by the plan’s administrator or, if no election is made, in a default alternative notional investment selected by the administrator. The following table sets forth non-qualified deferred compensation activity for each NEO during fiscal 2021. | | | | | | | | | | | | | | | | | | | | | | | | | | | Name | | Executive
Contributions
In Last Fiscal
Year ($)(1) | | | SSI
Contributions
in Last Fiscal
Year ($) | | | Aggregate
Earnings
In Last Fiscal
Year ($)(2) | | | Aggregate
Withdrawals/
Distributions
($) | | | Aggregate
Balance
($) | | Tamara L. Lundgren | | | — | | | | — | | | | — | | | | — | | | | — | | Richard D. Peach | | | 2,400 | | | | — | | | | 35 | | | | — | | | | 2,435 | | Michael R. Henderson | | | — | | | | — | | | | — | | | | — | | | | — | | Steven G. Heiskell | | | — | | | | — | | | | — | | | | — | | | | — | | Peter B. Saba | | | 80,000 | | | | — | | | | 1,927 | | | | — | | | | 81,927 | |
| (1) | Amounts in this column are also included in the Summary Compensation table in the “Salary” and “Non-Equity Incentive Plan Compensation Earnings” columns for fiscal 2021. |
| (2) | These amounts are not included in the Summary Compensation table because plan earnings were not preferential or above market. |
| | | | | | | Notice of Annual Meeting of Shareholders and 20182021 Proxy Statement | | | | 57 | 62 |
| | |
| | Compensation of Executive Officers |
Defined Benefit Retirement Plans Pension Retirement Plan.The Company’s Pension Plan is a defined benefit plan qualified under Section 401(a) of the Code. Persons who werenon-union employees of the Company prior to May 15, 2006 are eligible to participate in the Pension Plan. Benefit accruals ceased on June 30, 2006. Generally, pension benefits become fully vested after five years of service and are paid in monthly installments beginning upon the later of retirement or age 65. Benefits accrued each year after August 31, 1986 and prior to June 30, 2006 in an amount equal to 2% of qualifying compensation earned in the applicable year. Qualifying compensation included base salary, subject to a legal limit for the year. Retirement benefits are payable at any time after termination of employment, subject to actuarial reduction for early start of payment before age 65. A participant may choose payment from various actuarial equivalent life annuity options or a lump sum. Death benefits are payable to a beneficiary in a lump sum; a surviving spouse may elect payment as a life annuity. Supplemental Executive Retirement Bonus Plan.The SERBP was adopted to provide a competitive level of retirement income for keycertain executive officers selected by the Board. SERBP benefits become fully vested after five years of continuous service. The SERBP establishes an annual target benefit for each participant based on continuous years of service. The target benefit is an annual amount paid for the life of the employee, which is the lesser of (i) the product of 2.6% and the average of the participant’s five consecutive calendar years of highest compensation (“Final Average Compensation”) multiplied by years of continuous service, but in no event more than 65% of Final Average Compensation, or (ii) the product of $291,856$307,776 (subject to annual adjustment) multiplied by a fraction, the numerator of which is the employee’s continuous years of service and the denominator of which is the greater of the number of continuous years of service or 25. Compensation includes all cash compensation from an employer that participates in the SERBP, including salary and adjusted bonus, without taking into account voluntary reductions. Adjusted bonus means the lesser of (i) the bonus amount paid or (ii) 25% of salary during the period for which the bonus was earned. The target benefit is reduced by 100% of primary social security benefits and the Company-paid portion of all benefits payable under the Company’s qualified retirement plans to determine the actual benefit payable under the SERBP. The actual benefit will be paid as a straight life annuity or in other actuarially equivalent forms chosen by the participant commencing on the later of retirement or age 60. A participant who retires before age 60 with at least 10 years of continuous service will receive an early retirement benefit commencing on the later of retirement or age 55 equal to the normal retirement benefit reduced by 4% for each year by which commencement of benefits precedes age 60. The CEO is the only NEO who participates in the SERBP and has reached the normal retirement age under the SERBP. Potential Payments Upon Termination or Change in Control Potential Payments Upon a Change in Control The Company has entered into achange-in-control agreement with the CEO which provides certain benefits if her employment is terminated by the Company without “cause” or by her for “good reason” during asix-month period preceding a “change in control” of the Company or within 24 months after a “change in control” of the Company. In this agreement, “change in control” is generally defined to include: the acquisition by any person of 20 percent or more of the Company’s outstanding Class A common stock; the nomination (and subsequent election) of a majority of the Company’s directors by persons other than the incumbent directors; or the consummation of a sale of all or substantially all of the Company’s assets or an acquisition of the Company through a merger or share exchange. “Cause” generally includes willful and continued failure to substantially perform assigned duties or willfully engaging in illegal conduct injurious to the Company, and “good reason” generally includes a change in position or responsibilities that does not represent a promotion, a decrease in compensation, or a base office relocation. The Company has also entered intochange-in-control agreements with the other NEOs which provide certain benefits if the officer’s employment is terminated by the Company without “cause” or by the officer for “good reason” within 18 months after a “change in control” of the Company. These agreements contain definitions of “change in control,” “cause,” and “good reason” which are substantially identical to those contained in thechange-in-control agreement for the CEO. | | | | | 58 | | | Notice of Annual Meeting of Shareholders and 2018 Proxy Statement |
| | |
| | Compensation of Executive Officers
|
The Company granted LTIP performance shares to the NEOs in fiscal 2016, 2017,2019, 2020, and 20182021 pursuant to which shares of Class A common stock will be issued based on the Company’s performance during the applicable performance periods relating to the awards. The award agreements relating to the LTIP performance shares provide for an accelerated payout | | | | Notice of Annual Meeting of Shareholders and 2021 Proxy Statement | | | 63 |
| | |
| | Compensation of Executive Officers |
of the performance shares upon a “Company sale,” which generally means a sale of the Company by means of a merger, share exchange, or sale of substantially all of the assets of the Company. In addition, award agreements relating to all outstanding RSUs provide for accelerated vesting on a change in control of the Company (which has the same meaning as under thechange-in-control agreements). An accelerated payout of LTIP performance shares and accelerated vesting of RSUs would occur even if the NEO’s employment was not terminated in connection with the Company sale or change in control. The following table sets forth the estimatedchange-in-control benefits that would have been payable to each NEO if a change in control (including a Company sale) had occurred on August 31, 20182021 and, except as noted, each officer’s employment had been terminated on that date either by the Company without “cause” or by the officer with “good reason.” | | | | | | | | | | | | | | | | | | | | | | | | | | | | | | | | | | | | Name | | Cash Severance Benefit ($)(1) | | Insurance Continuation ($)(2) | | Restricted Stock Unit Acceleration
($)(3) | | LTIP Performance Shares Acceleration
($)(4) | | Tax Gross-up Payment ($)(5) | | 280G
Cut-Back ($)(5) | | Total ($) | Tamara L. Lundgren | | | | 13,134,879 | | | | | 462,108 | | | | | 6,094,966 | | | | | 9,143,003 | | | | | 9,973,694 | | | | | — | | | | | 38,808,650 | | Richard D. Peach | | | | 2,190,619 | | | | | 35,807 | | | | | 1,671,776 | | | | | 2,507,598 | | | | | — | | | | | — | | | | | 6,405,800 | | Michael R. Henderson | | | | 1,842,667 | | | | | 28,527 | | | | | 1,295,288 | | | | | 1,958,938 | | | | | — | | | | | (43,697 | ) | | | | 5,081,723 | | Steven G. Heiskell | | | | 1,430,566 | | | | | 23,601 | | | | | 1,148,361 | | | | | 1,958,938 | | | | | — | | | | | (813,538 | ) | | | | 3,747,928 | | Jeffrey Dyck | | | | 1,316,374 | | | | | 24,981 | | | | | 887,969 | | | | | 1,345,142 | | | | | — | | | | | — | | | | | 3,574,466 | |
| | | | | | | | | | | | | | | | | | | | | | | | | | | | | | | | | | | | | Name | | Cash
Severance
Benefit
($)(1) | | | Insurance
Continuation
($)(2) | | | Restricted
Stock Unit
Acceleration
($)(3) | | | LTIP
Performance
Shares
Acceleration
($)(4) | | | Tax Gross-up Payment ($)(5) | | | 280G Cut-Back ($)(5) | | | Total ($) | | Tamara L. Lundgren | | | 11,008,590 | | | | 222,401 | | | | 12,497,315 | | | | 18,865,809 | | | | 14,387,679 | | | | — | | | | 56,981,794 | | Richard D. Peach | | | 2,240,846 | | | | 41,889 | | | | 3,344,297 | | | | 5,023,612 | | | | — | | | | (159,705 | ) | | | 10,490,939 | | Michael R. Henderson | | | 1,935,366 | | | | 33,404 | | | | 2,612,789 | | | | 3,924,742 | | | | — | | | | (122,557 | ) | | | 8,383,744 | | Steven G. Heiskell | | | 1,691,615 | | | | 27,701 | | | | 2,612,789 | | | | 3,924,742 | | | | — | | | | (899,787 | ) | | | 7,357,060 | | Peter B. Saba | | | 1,396,503 | | | | 40,176 | | | | 1,741,860 | | | | 2,616,339 | | | | — | | | | (335,244 | ) | | | 5,459,634 | |
| (1) | Cash Severance Benefit.Thechange-in-control agreements provide for cash severance equal to a multiple (three for Ms. Lundgren, and one andone-half for Messrs. Peach, Henderson, Heiskell, and Dyck)Saba) times the sum of (a) the officer’s base salary plus (b) the greater of (1) the average of the officer’s last three annual bonuses, except that for Ms. Lundgren the amount taken into account for any such bonus shall not exceed three times the target bonus for such year, or (2) the most recently established target bonus. Thechange-in-control agreements also provide for a payment of all or a portion of the annual bonus for the year in which termination occurs. The table above does not include a bonus payment for fiscal 20182021 because bonuses earned for fiscal 20182021 are included in the Summary Compensation Table and no additional amount would have been earned in fiscal 20182021 if the officer had terminated employment as of August 31, 2018.2021. |
| (2) | Insurance Continuation.If cash severance benefits are triggered, thechange-in-control agreements also provide for continuation of Company paid life, accident, and medical insurance benefits for up to 36 months following termination of employment for Ms. Lundgren, and up to 18 months for Messrs. Peach, Henderson, Heiskell, and Dyck,Saba, except to the extent similar benefits are provided by a subsequent employer. The amounts in the table above represent 36 or 18 months, as applicable, of life, accident, and medical insurance benefit payments at the rates paid by the Company for each of these officers as of August 31, 2018.2021. |
| (3) | RSU Acceleration.All RSUs for all NEOs will immediately vest on a change in control of the Company, whether or not the officer’s employment is terminated in connection with the change in control. Information regarding unvested RSUs held by the NEOs is set forth in the “Outstanding Equity Awards” table. The amounts in the table above represent the number of shares subject to unvested RSUs multiplied by a stock price of $26.35$47.31 per share, which was the closing price of the Company’s Class A common stock on August 31, 2018,2021, the last trading day of fiscal 2018.2021. |
| (4) | LTIP Performance Share Acceleration.Under the terms of the standard LTIP performance share award agreements, upon a Company sale, each NEO would receive a payout in an amount equal to the greater of (a) 100% of the target share amount, or (b) the payout calculated as if the performance period had ended on the last day of the Company’s most recently completed fiscal quarter prior to the date of the Company sale, taking into account provisions in the award agreements for calculating performance for a shorter performance period and a partial year. The accelerated payouts would occur whether or not the officer’s employment was terminated in connection with the Company sale. The amounts in the table above represent the value of outstanding LTIP performance share awards that would vest and be paid out pursuant to the terms of the award agreements on a Company sale based on a stock price of $26.35$47.31 per share, which was the closing price of the Company’s Class A common stock on August 31, 2018,2021, the last trading day of fiscal 2018.2021. |
| (5) | 280G TaxGross-up Payment andCut-Back.If any payments to Ms. Lundgren and Messrs.Mr. Peach and Dyck in connection with a change in control are subject to the 20% excise tax on “excess parachute payments” as defined in Section 280G of the Code, the Company is required under thechange-in-control agreements to make a taxgross-up payment to the NEO sufficient so that the NEO will receive benefits as if no excise tax were payable. However, for Messrs.Mr. Peach and Dyck there is acut-back provision that provides that if the “parachute value” is less than 110% of the Safe Harbor amount (as such terms are defined in thechange-of-control agreement), no additional payment is required and the amounts payable to the NEO will be reduced to 2.99 times the NEO’s “base amount.” In 2011, the Committee approved a revised form of change-in-control agreement, which does not include any tax gross-up provisions, and this form has been used for agreements with Messrs. Henderson, Heiskell and Saba. Thechange-in-control agreements for each of Messrs. Henderson, Heiskell and HeiskellSaba therefore do not provide for any taxgross-up payment, but do provide that if any payments to the NEO would be “excess parachute payments” the NEO’s benefits would becut-back to 2.99 times the NEO’s “base amount” if it would result in a greater netafter-tax benefit for the NEO. Thecut-back amounts shown above for Messrs. Henderson and Heiskell represents the estimated amount of the reduction to avoid a penalty tax under Section 280G of the Code. |
| | | | | | | Notice of Annual Meeting of Shareholders and 20182021 Proxy Statement | | | | 59 | 64 |
| | |
| | Compensation of Executive Officers |
Potential Payments Upon Involuntary Termination of Employment without Cause or Voluntary Termination of Employment for “Good Reason” in Circumstances Not Involving a Change in Control The following table sets forth the estimated benefits that would have been payable to the NEOs under currently effective agreements if each officer’s employment had been terminated on August 31, 2018,2021, either by the Company without “cause” or, with respect to certain benefits, by the officer for “good reason” in circumstances not involving a change in control. | | Name | | Cash Severance Benefit ($)(1) | | Insurance Continuation ($)(2) | | Restricted Stock Unit Acceleration ($)(3) | | LTIP Performance Shares Acceleration ($)(4) | | Total ($) | | Cash
Severance
Benefit
($)(1) | | | Insurance
Continuation
($)(2) | | | Restricted
Stock Unit
Acceleration
($)(3) | | | LTIP
Performance
Shares
Acceleration
($)(4) | | | Total ($) | | Tamara L. Lundgren | | | 13,134,879 | | | | 308,072 | | | | 6,094,966 | | | | 5,083,600 | | | | 24,621,517 | | | | 11,032,710 | | | | 148,267 | | | | 12,497,315 | | | | 6,522,866 | | | | 30,201,158 | | Richard D. Peach | | | — | | | | — | | | | — | | | | 1,394,152 | | | | 1,394,152 | | | | — | | | | — | | | | — | | | | 1,736,845 | | | | 1,736,845 | | Michael R. Henderson | | | — | | | | — | | | | — | | | | 1,089,125 | | | | 1,089,125 | | | | — | | | | — | | | | — | | | | 1,356,851 | | | | 1,356,851 | | Steven G. Heiskell | | | — | | | | — | | | | — | | | | 1,089,125 | | | | 1,089,125 | | | | — | | | | — | | | | — | | | | 1,356,851 | | | | 1,356,851 | | Jeffrey Dyck | | | — | | | | — | | | | — | | | | 747,813 | | | | 747,813 | | | Peter B. Saba | | | | — | | | | — | | | | — | | | | 904,473 | | | | 904,473 | |
| (1) | Cash Severance Benefit.The CEO has entered into an employment agreement providing for, among other things, cash severance benefits if her employment is terminated by the Company without “cause” or by her for “good reason” in circumstances not involving a change in control. “Cause” and “good reason” generally have the same meaning as under thechange-in-control agreements described above. The cash severance payment for the CEO is equal to three times the sum of base salary plus the greater of (1) the average of the last three annual bonuses, except that the amount taken into account for any such bonus shall not exceed three times the target bonus as in effect atfor such year, or (2) the time plusmost recently established target bonus. The employment agreement also provides for payment of a pro rata portion of the incentive bonus that she would have received if she had remained employed for the fiscal year in which the termination occurs (based on the portion of the year worked). The table above does not include a pro rata portion of the incentive bonus for fiscal 20182020 because bonuses earned for fiscal 20182021 are included in the Summary Compensation Table and no additional amounts would have been earned if the CEO had terminated employment as of August 31, 2018.2021. These amounts are payable within 30 days after termination. Under the AICP, if an NEO (other than the CEO) were involuntarily terminated by the Company without cause“cause” (as determined by the Committee), the NEO would receive, at the time that bonuses under the program were determined and paid for other participants, a bonus based on the officer’s earnings for the portion of the year the participant was employed. For this purpose, the officer would be deemed to have satisfied the officer’s individual goals. The table above does not include bonus payments for fiscal 20182021 because bonuses earned for fiscal 20182021 are included in the Summary Compensation Table, and no additional amounts would have been earned if the officers had terminated employment as of August 31, 2018.2021. |
| (2) | Insurance Continuation.If cash severance benefits are triggered under the CEO’s employment agreement, her employment agreement provides for continuation for up to 24 months of Company paid life, accident, and health insurance benefits for the CEO and her spouse and dependents, and the amount in the table represents 24 months of such insurance benefit payments at the rates paid by us for the CEO as of August 31, 2018.2021. |
| (3) | RSU Acceleration.If cash severance benefits are triggered under the CEO’s employment agreement, her employment agreement also provides that all RSUs will immediately vest. Information regarding unvested restricted stock units held by the CEO is set forth in the Outstanding Equity Awards table. The amount in the table above represents the number of shares subject to unvested RSUs multiplied by a stock price of $26.35$47.31 per share, which was the closing price of the Company’s Class A common stock on August 31, 2018,2021, the last trading day of fiscal 2018.2021. |
| (4) | LTIP Performance Shares Acceleration.Under the terms of the standard LTIP performance share award agreements, if an NEO’s employment is terminated by the Company without cause“cause” in circumstances not involving a Company sale after the end of the twelfth month of the applicable performance period and prior to the completion of the performance period and vesting date, the NEO would be entitled to receive apro-rated award to be paid following completion of the performance period, taking into account the number of performance shares that would otherwise have been issued based on the actual performance during the entire performance period and the portion of the performance period the officer had worked. The officer is required to provide a release of claims in connection with such payout. For this purpose, “cause” generally means (a) the conviction of the officer of a felony involving theft or moral turpitude or relating to the business of the Company, (b) the officer’s continued failure to perform assigned duties, (c) fraud or dishonesty by the officer in connection with employment with the Company, (d) any incident materially compromising the officer’s reputation or ability to represent the Company with the public, (e) any willful misconduct that substantially impairs the Company’s business or reputation, or (f) any other willful misconduct by the officer that is clearly inconsistent with the officer’s position or responsibilities. The amounts in the table above are calculated based on actual performance for completed performance periods and assume performance at the 100% payout level (actual performance may be more or less) for incomplete performance periods, with the resulting number of performance shares then multiplied by a stock price of $26.35$47.31 per share, which was the closing price of the Company’s Class A common stock on August 31, 2018,2021, the last trading day of fiscal 2018.2021. |
| | | | | 60 | | | Notice of Annual Meeting of Shareholders and 20182021 Proxy Statement | | | 65 |
| | |
| | Compensation of Executive Officers |
Potential Payments Upon Retirement The terms of outstanding RSUs and LTIP performance share awards define retirement as normal retirement after reaching age 65, early retirement after reaching age 55 and completing 10 years of service, or early retirement after completing 30 years of service. As of August 31, 2018, no NEOs other than2021, Ms. Lundgren and Mr. DyckPeach were eligible for retirement. The following table sets forth the estimated benefits that would have been payable to Ms. Lundgren and Mr. DyckPeach if their employment had been terminated on August 31, 20182021 by reason of retirement, excluding amounts payable under the Company’s 401(k) Plan, Pension Plan and SERBP. | | Name | | Restricted Stock Unit Acceleration ($)(1) | | | LTIP Performance Shares Acceleration ($)(2) | | | Total ($) | | | Restricted Stock Unit Acceleration ($)(1) | | | LTIP Performance Shares Acceleration ($)(2) | | | Total ($) | | Tamara L. Lundgren | | | 6,094,966 | | | | 5,676,686 | | | | 11,771,652 | | | | 12,497,315 | | | | 8,808,081 | | | | 21,305,396 | | Jeffrey Dyck | | | 887,969 | | | | 744,414 | | | | 1,632,383 | | | Richard D. Peach | | | | 3,344,297 | | | | 2,774,258 | | | | 6,118,555 | |
| (1) | RSU Acceleration.Acceleration or Continued Vesting. The terms of the RSU awards granted prior to fiscal 2020 provide for accelerated vesting on retirement. The RSU awards granted during fiscal 2020 and 2021 provide for continued vesting on the original scheduled vesting dates (subject to continued compliance with the non-competition requirements set forth in the award agreements) in the event of a retirement that occurs at least two years following the grant date. The amounts in the table above represent the number of unvested RSU shares subject to accelerated and/or continued vesting, as applicable, multiplied by a stock price of $26.35$47.31 per share, which was the closing price of the Company’s Class A common stock on August 31, 2018,2021, the last trading day of fiscal 2018.2021. |
| (2) | LTIP Performance Shares Acceleration.Under the terms of the standard LTIP performance share awards, if an NEO retires prior to the vesting date, the NEO would be entitled to receive apro-rated award to be paid following completion of the performance period, taking into account the number of performance shares that would otherwise have been issued based on the actual performance through the entire performance period and the portion of the performance period the officer had worked. The NEO is required to provide a release of claims in connection with such payout. The amounts in the table above are calculated based on actual performance for completed performance periods and assume performance at the 100% payout level (actual performance may be more or less) for incomplete performance periods, with the resulting number of performance shares then multiplied by a stock price of $26.35$47.31 per share, which was the closing price of the Company’s Class A common stock on August 31, 2018,2021, the last trading day of fiscal 2018.2021. |
Potential Payments Upon Disability or Death The following table sets forth the estimated benefits that would have been payable to the NEOs if each officer’s employment had been terminated on August 31, 20182021 by reason of disability or death, excluding amounts payable under the Company’s 401(k) Plan, Pension Plan, and SERBP. | | | Name | | Restricted Stock Unit Acceleration ($)(1) | | | LTIP Performance Shares Acceleration ($)(2) | | | Total ($) | | | Restricted Stock Unit Acceleration ($)(1) | | | LTIP Performance Shares Acceleration ($)(2) | | | Total ($) | | Tamara L. Lundgren | | | 6,094,966 | | | | 6,044,321 | | | | 12,139,287 | | | | 12,497,315 | | | | 10,418,750 | | | | 22,916,065 | | Richard D. Peach | | | 1,671,776 | | | | 1,657,652 | | | | 3,329,428 | | | | 3,344,297 | | | | 2,774,258 | | | | 6,118,555 | | Michael R. Henderson | | | 1,295,288 | | | | 1,294,944 | | | | 2,590,232 | | | | 2,612,789 | | | | 2,167,318 | | | | 4,780,107 | | Steven G. Heiskell | | | 1,148,361 | | | | 1,325,589 | | | | 2,473,950 | | | | 2,612,789 | | | | 2,167,318 | | | | 4,780,107 | | Jeffrey Dyck | | | 887,969 | | | | 696,510 | | | | 1,584,479 | | | Peter B. Saba | | | | 1,741,860 | | | | 1,444,800 | | | | 3,186,660 | |
| (1) | RSU Acceleration.The terms of the RSU awards provide for accelerated vesting upon termination of employment as a result of disability or death. Information regarding unvested RSUs held by the NEOs is set forth in the “Outstanding Equity Awards” table above. The amounts in the table above represent the number of shares subject to unvested RSUs multiplied by a stock price of $26.35$47.31 per share, which was the closing price of the Company’s Class A common stock on August 31, 2018,2021, the last trading day of fiscal 2018.2021. |
| (2) | LTIP Performance Shares Acceleration. Under the terms of the standard LTIP performance share awards, if an NEO’s employment is terminated due to death or disability prior to the vesting date, the officer (or his or her estate) would receive a payout in an amount equal to the payout calculated as if the performance period had ended on the last day of the Company’s most recently completed fiscal quarter prior to the date of employment termination, taking into account provisions in the award agreement for calculating performance for a shorter performance period and a partial year, andpro-rated for the portion of the performance period the officer had worked. The amounts in the table above represent the value of outstanding LTIP performance share awards that would vest and be paid out pursuant to the terms of the award agreements on death or disability based on a stock price of $26.35$47.31 per share, which was the closing price of the Company’s Class A common stock on August 31, 2018,2021, the last trading day of fiscal 2018.2021. |
| | | | | | | Notice of Annual Meeting of Shareholders and 20182021 Proxy Statement | | | | 61 | 66 |
| | |
| | Compensation of Executive Officers |
CEO Pay Ratio Pursuant to requirements established by the Dodd-Frank Wall Street Reform and Consumer Protection Act, and the SEC rules and guidance adopted thereunder, we have evaluated the compensation of the Company’s CEO with the compensation of the Company’s median paid employee. The pay ratio information presented below is based upon a selected methodology which includes reasonable estimates calculated in a manner consistent with Item 402(u) of RegulationS-K under the Securities Exchange Act of 1934. We determined the median compensated employee based upon review of annual compensation for all employees as of July 31, 2018.2021. The measure of compensation used to identify our median employee was consistently applied to all employees and included: salary, base wages and overtime (as applicable), incentive payments, health and welfare benefits, retirement contributions, and other cash payments. To facilitate comparability among our employee population, we annualized compensation for employees who startedmid-year and applied a local currency to U.S. dollar exchange rate to translatenon-U.S. employee compensation to U.S. dollars. After determining the median employee, the annual compensation for our median employee was calculated in a manner consistent with the CEO’s annual total compensation reflected in the Summary Compensation Table and then adjusted to include the value of health benefits provided to the median employee during the fiscal year. For the purpose of calculating the CEO pay ratio, the CEO compensation was determined to be $9,100,109,$10,163,273, which matches the sum of Ms. Lundgren’s annual total compensation as reflected in the Summary Compensation Table plus health benefits of $11,574.$13,810. The annual total compensation for our median employee was $55,469.$65,991. As a result, Ms. Lundgren’s annual total compensation for 20182021 was approximately 164154 times that of our median employee. The SEC rules for identifying the median compensated employee and calculating the pay ratio allow companies to utilize different methodologies, to apply certain exclusions, and to make reasonable estimates and assumptions that reflect their employee population and compensation practices. As a result, the pay ratios reported by other companies may not be comparable to our CEO pay ratio. Compensation Plan Information The following table provides information as of August 31, 20182021 regarding equity compensation plans approved and not approved by the Company’s shareholders. | | | Plan category | | (a) Number of Securities
to be Issued(2) | | (b) Number of Securities
Remaining Available
for Future Issuance
Under Equity
Compensation Plans
(Excluding Securities
Reflected in Column
(a)) | | (a)
Number of Securities
to be Issued(2) | | (b)
Number of Securities
Remaining Available for Future Issuance
Under Equity
Compensation Plans
(Excluding Securities
Reflected in Column (a)) | Equity compensation plans approved by shareholders(1) | | | | 2,572,314 | | | | | 3,907,093 | | | | 2,886,250 | | | | 2,214,343 | | Equity compensation plans not approved by shareholders | | | | — | | | | | — | | | | — | | | | — | | Total | | | | 2,572,314 | | | | | 3,907,093 | | | | 2,886,250 | | | | 2,214,343 | |
| (1) | Consists entirely of shares of Class A common stock authorized for issuance under the Company’s SIP. |
| (2) | Consists of 809,237956,347 shares subject to outstanding RSUs, 326,532436,038 shares subject to outstanding DSUs or credited to stock accounts under the Deferred Compensation Plan forNon-Employee Directors, and 1,436,5451,493,865 shares representing the maximum number of shares that could be issued under outstanding LTIP performance share awards. |
| | | | | 62 | | | Notice of Annual Meeting of Shareholders and 20182021 Proxy Statement | | | 67 |
Proposal No. 2 – Advisory Resolution on Executive Compensation As required pursuant to section 14A of the Securities Exchange Act, we are including in these proxy materials a separate resolution to approve, in anon-binding, advisory vote(“Say-on-Pay vote”), the compensation paid to our named executive officers as disclosed on pages 3137 through 62.67. While the results of the vote arenon-binding and advisory in nature, the Board of Directors and the Compensation Committee intend to carefully consider the results of this vote. We hold ourSay-on-Pay vote every year and, unless the Board of Directors modifies its policy on the frequency ofSay-on-Pay votes, the nextSay-on-Pay vote will occur at our annual meeting to be held in 2020.2023. The text of the resolution in respect of Proposal No. 2 is as follows: RESOLVED, that the Company’s shareholders approve, on an advisory basis, the compensation of the named executive officers, as disclosed in this proxy statement pursuant to Item 402 of RegulationS-K, including the Compensation Discussion and Analysis, compensation tables, and any related narrative discussion. The Board of Directors recommends a vote FOR this resolution because it believes that our executive compensation policies and practices described in the Compensation Discussion and Analysis are effective in achieving the Company’s goals of rewarding sustained financial and operating performance and leadership excellence, aligning the executives’ long-term interests with those of the shareholders, and motivating the executives to remain with the Company for long and productive careers. We believe our performance targets are meaningful and rigorous and are designed to encourage our executives to perform at the highest levels. The executive pay outcomes in fiscal 20182021 are reflective of Company performance. Our executive compensation program is designed to pay for performance, therefore actual compensation in fiscal 2018 was higher than target levels, which reflected alignment with the Company’s financial performance during the period.
Vote Required to Approve, on an Advisory Basis, the Executive Compensation Holders of Class A common stock and Class B common stock will vote together as a single class on this proposal, and each share is entitled to one vote. The advisory vote on executive compensation will be approved if the votes cast favoring the proposal exceed the votes cast opposing the proposal. The proxies will be voted for or against the proposal or as an abstention in accordance with the instructions specified on the proxy form. If no instructions are given by owners of record, proxies will be voted for approval of the executive compensation. The Board of Directors recommends that shareholders vote“FOR” the approval, on an advisory basis, of our executive compensation as disclosed in this proxy statement.
| The Board of Directors recommends that shareholders vote “FOR” the approval, on an advisory basis, of our executive compensation as disclosed in this proxy statement. |
| | | | | | Notice of Annual Meeting of Shareholders and 20182021 Proxy Statement | | | | 63 | 68 |
Proposal No. 3 – Ratification of Selection of Independent Registered Public Accounting Firm The Audit Committee of the Board of Directors has selected the firm of PricewaterhouseCoopers LLP to serve as the Company’s independent registered public accounting firm for the fiscal year ending August 31, 2019,2022, subject to ratification of this selection by the shareholders of the Company. While the Audit Committee is directly responsible for the appointment, compensation, retention, and oversight of the Company’s independent registered public accounting firm, the Audit Committee and the Board are submitting the selection of PricewaterhouseCoopers LLP to our shareholders for ratification as a matter of good corporate governance. The Audit Committee is not required to take any action as a result of the outcome of the vote on this proposal. However, if our shareholders do not ratify the selection, the Audit Committee will consider whether to retain PricewaterhouseCoopers LLP or to select another independent registered public accounting firm. Furthermore, even if the selection is ratified, the Audit Committee in its discretion may appoint a different independent registered public accounting firm at any time during the year if it determines that such a change would be in the best interests of our Company and our shareholders. For additional information regarding our relationship with PricewaterhouseCoopers LLP, please refer to “Fees Paid to Independent Registered Public Accounting Firm” and “Audit Committee Report” below. One or more representatives of PricewaterhouseCoopers LLP are expected to be present atattend the Annual Meeting. Such representatives will have an opportunity to make a statement, if he or she desires to do so, and will also be available to respond to appropriate questions. Vote Required to Approve the Ratification of the Selection of Independent Registered Public Accounting Firm Holders of Class A common stock and Class B common stock will vote together as a single class on this proposal, and each share is entitled to one vote. The ratification of the selection of PricewaterhouseCoopers LLP as the Company’s independent registered public accounting firm will be approved if the votes cast favoring the proposal exceed the votes cast opposing the proposal. The proxies will be voted for or against the proposal or as an abstention in accordance with the instructions specified on the proxy form. If no instructions are given by owners of record, proxies will be voted for approval of the ratification of the selection. The Board of Directors recommends that shareholders vote“FOR” to approve the ratification of the selection of independent registered public accounting firm.
| The Board of Directors recommends that shareholders vote “FOR” to approve the ratification of the selection of independent registered public accounting firm. |
| | | | | 64 | | | Notice of Annual Meeting of Shareholders and 20182021 Proxy Statement | | | 69 |
Fees Paid to Independent Registered Public Accounting Firm The Audit Committee selected PricewaterhouseCoopers LLP (“PwC”) as our independent auditors to audit our financial statements and our internal control over financial reporting for the fiscal years ended August 31, 20172020 and 2018,2021, as well as for the fiscal year ending August 31, 2019.2022. Aggregate fees of PwC for audit services related to the most recent two fiscal years, and other professional services for which they billed us during the most recent two fiscal years, were: | | | | | 2018 | | | 2017 | | | 2021 | | | 2020 | | Audit Fees(1) | | $ | 2,597,543 | | | $ | 2,272,445 | | | $ | 2,389,268 | | | $ | 2,534,359 | | Audit Related Fees | | | 47,000 | | | | 10,000 | | | Audit Related Fees(2) | | | | — | | | | 67,000 | | Tax Fees | | | — | | | | — | | | | — | | | | — | | All Other Fees | | | 4,500 | | | | 3,600 | | | All Other Fees(3) | | | | 122,942 | | | | 17,000 | | | | | | | | | | | | | | | Total | | $ | 2,649,043 | | | $ | 2,286,045 | | | $ | 2,512,210 | | | $ | 2,618,359 | |
| (1) | Professional services rendered for the integrated audit of our annual consolidated financial statements and internal control over financial reporting, reviews of the consolidated financial statements included in Form10-Qs, consents relating to other filings with the SEC, and statutory audit requirements. |
| (2) | In fiscal 2020, fees related to professional services for procedures performed over disclosures and other procedures related to the implementation of new accounting standards. |
| (3) | In fiscal 2021, fees primarily related to professional services for procedures performed as part of a pre-implementation review of an IT system development. |
For fiscal 20182021 and 2017,2020, all of the fees paid to our independent auditors were approved by the Audit Committee. Under the Sarbanes-Oxley Act of 2002, all audit andnon-audit services performed by our independent accountants must be approved in advance by the Audit Committee to assure that such services do not impair the accountants’ independence from the Company. Accordingly, the Audit Committee has adopted an Audit andNon-Audit ServicesPre-Approval Policy (the “Policy”) which sets forth the procedures and the conditions pursuant to which services to be performed by the independent accountants are to bepre-approved. Pursuant to the Policy, certain services described in detail in the Policy may bepre-approved on an annual basis. The Audit Committee will review and approve the types of services and review the projected fees for such services. The fee amounts will be updated to the extent necessary at each of the regularly scheduled meetings of the Audit Committee. The services eligible for annualpre-approval consist of services that would be included under the categories of Audit Fees, Audit-Related Fees, and Tax Fees in the above table as well as other services. If notpre-approved on an annual basis, proposed services must otherwise be separately approved prior to being performed by the independent accountants. The Audit Committee may delegate authority topre-approve audit andnon-audit services to any member of the Audit Committee but may not delegate such authority to management. All compensation for services performed by our independent accountants must be approved by the Audit Committee. Committee, provided, however, that the Chair of the Audit Committee has delegated authority to approve any adjustments to fees to be paid to our independent accountants for audit and audit-related services or for tax services or other services in excess of amounts previously approved by the Audit Committee for such services, provided that any such adjustments in the aggregate do not exceed 10% (or such other percentage as specifically approved by the Audit Committee in a particular instance) of the base fee for audit and audit-related services or for tax services or other services, respectively, for any fiscal year. Audit Committee Report The principal functions of the Audit Committee are set forth in its charter and are described above at page 24.29. The Board has determined that each member of the Audit Committee meets all additional independence and financial literacy requirements for Audit Committee membership under the SEC and NASDAQ rules and is an “audit committee financial expert” as defined in the regulations adopted by the SEC. The Audit Committee reports as follows with respect to fiscal 2018:2021: Financial Reporting and Other Activities Management is responsible for the Company’s systems of internal control and the financial reporting process. The Audit Committee reviewed the Company’s quarterly earnings press releases, annual audited consolidated financial statements, management’s report on internal control over financial reporting, and related periodic reports filed with the | | | | Notice of Annual Meeting of Shareholders and 2021 Proxy Statement | | | 70 |
| | | financial statements, management’s report on internal control over financial reporting, and related periodic reports filed with the SEC and discussed them with management. Management represented to the Audit Committee that the Company’s audited consolidated financial statements were prepared in accordance with accounting principles generally accepted in the United States of America. The Audit Committee also reviewed and discussed the annual audited consolidated financial statements with PricewaterhouseCoopers LLP (“PwC”), the Company’s independent registered public accounting firm for fiscal 2018,2021, including a discussion of the quality, and not just the acceptability, of the accounting principles used and the reasonableness of significant judgments.
|
| | | | | | | Notice of Annual Meeting of Shareholders and 2018 Proxy Statement | | | | 65 | |
| | |
| | |
The Audit Committee discussed with management on a quarterly basis the details of the Company’s material legal and environmental matters, certain judgmental accounting matters, and other significant financial transactions occurring within each quarter, reviewing and approving, as appropriate, all transactions with related persons, the Company’s compliance program, reports received through the Company’s whistleblower hotline, and other selected risk-related topics. Internal Audit and External Audit Firm Functions The Audit Committee discussed with the Company’s internal auditor and PwC the overall scope and plans for their respective audits. The Audit Committee met quarterly with the internal auditor and PwC to discuss the results of their examinations and the overall quality of the Company’s financial reporting. The Audit Committee’s quarterly meetings with internal audit included reviews of the risk assessment process used to establish the annual audit plan and the progress on completion of that plan including testing of controls in connection with the Company’s compliance with Sarbanes-Oxley.Sarbanes-Oxley Act of 2002. The Audit Committee discussed with PwC the matters required to be discussed underby the applicable requirements of the Public Company Accounting Oversight Board standards.and the Commission. Audit Firm Independence The Audit Committee is directly responsible for the appointment, compensation, retention, and oversight of the independent registered public accounting firm retained to audit the Company’s financial statements. PwC has served as the Company’s auditor since 1976, which includes periods before the Company became public in fiscal 1993. In determining whether to reappoint PwC, the Audit Committee takes into consideration various factors, including: the historical and recent performance of PwC on the audit; its professional qualifications; the quality of ongoing discussions with PwC; external data, including recent PCAOB reports on PwC and its peer firms; the appropriateness of fees and PwC’s tenure, including the benefits of that tenure, and the controls and processes in place (such as rotation of key partners every five years) that help ensure PwC’s continued independence in the face of such tenure. The Audit Committee believes there are significant benefits to having an independent auditor with an extensive history with the Company. These include: | | PwC; external data, including recent PCAOB reports on PwC and its peer firms; the appropriateness of fees and PwC’s tenure, including the benefits of that tenure, and the controls and processes in place (such as rotation of key partners every five years) that help ensure PwC’s continued independence in the face of such tenure. The Audit Committee believes there are significant benefits to having an independent auditor with an extensive history with the Company. These include:
|
| | – | Higher quality audit work and accounting advice, due to PwC’s institutional knowledge of our business and operations, accounting policies and financial systems, and internal control framework; and |
| | – | Operational efficiencies because of PwC’s history and familiarity with our business. |
The Audit Committee received from PwC the written disclosures required by applicable requirements of the Public Company Accounting Oversight Board regarding PwC’s independence. The Audit Committee discussed with PwC the firm’s independence from the Company and its management. Conclusion Based on the reviews and discussions referred to above, the Audit Committee recommended to the Board of Directors that the audited financial statements be included in the Company’s Annual Report on Form10-K for the year ended August 31, 20182021 filed with the SEC. The Audit Committee also has selected PwC to be the Company’s independent registered public accounting firm for fiscal 2019,2022, subject to shareholder ratification. AUDIT COMMITTEE David L. Jahnke, Chair Glenda J. Minor Rhonda D. Hunter William D. Larsson Michael W. Sutherlin
| | | | | 66 | | | Notice of Annual Meeting of Shareholders and 20182021 Proxy Statement | | | 71 |
Certain Transactions The Audit Committee charter requires the Audit Committee to review any reportable transaction or proposed transaction with a related person, or in which a related person has a direct or indirect interest, and determine whether to ratify or approve the transaction, with ratification or approval to occur only if the Audit Committee determines that the transaction is fair to the Company or that approval or ratification of the transaction is in the interest of the Company. The Audit Committee reviewed and ratified or approved the following reportable related transaction for fiscal 2021: One of our executive officers, Michael Henderson, has an immediate family member, Brian Henderson, who is employed by a subsidiary of the Company. The compensation of Brian Henderson was established by the Company in accordance with its employment and compensation practices applicable to employees with equivalent qualifications and responsibilities and holding similar positions. Michael Henderson does not have a material interest in the employment relationship nor does he share a household with the employee. Brian Henderson received fiscal 2021 compensation of $218,166. Delinquent Section 16(a) Reports Section 16(a) of the Securities Exchange Act of 1934 requires our directors, executive officers, and persons who beneficially own more than 10% of our outstanding common stock to file with the SEC reports of beneficial ownership and changes in beneficial ownership of our common stock held by such persons. Executive officers, directors, and greater than 10% shareholders are also required to furnish us copies of all forms they file under this regulation. To our knowledge, based solely on a review of the copies of such reports furnished to us and representations that no other reports were required, during fiscal 2021, we believe that all required Section 16(a) reports were timely filed for such fiscal year, other than one late Form 4 filing for each of the Company’s independent directors related to one transaction involving the automatic reinvestment of dividends under the Company’s Deferred Compensation Plan for Non-Employee Directors as a result of an administrative error. Shareholder Proposals for 20202023 Annual Meeting The Company’s Bylaws require shareholders to give the Company advance notice of any proposal or director nomination to be submitted at any meeting of shareholders and prescribe the information to be contained in any such notice. For any shareholder proposal or nomination to be considered at the 20202023 annual meeting of shareholders, the shareholder’s notice must be received at the Company’s principal executive office no earlier than the close of business on October 1, 2019September 27, 2022 and no later than the close of business on October 31, 201927, 2022 and otherwise comply with the requirements of the Company’s Bylaws. In addition, any proposal by a shareholder of the Company to be considered for inclusion in proxy materials for the Company’s 20202023 annual meeting of shareholders must be received in proper form by the Company at its principal executive office no later than August 21, 2019.17, 2022. Discretionary Authority Although the Notice of Annual Meeting of Shareholders provides for the transaction of any other business that properly comes before the meeting, the Board has no knowledge of any matters to be presented at the meeting other than the matters described in this Proxy Statement.proxy statement. The enclosed proxy, however, gives discretionary authority to the proxy holders to vote in accordance with their best judgment if any other matters are presented. Householding of Proxy Materials The SEC has adopted rules that permit companies and intermediaries (e.g., brokers) to satisfy the delivery requirements for proxy statements and annual reports with respect to two or more shareholders sharing the same address by delivering a single proxy statement and annual report addressed to those shareholders. This process, which is commonly referred to as “householding,” potentially means extra convenience for shareholders and cost savings for companies. Because we are using the SEC’s notice and access rule and are delivering proxy materials electronically, we will not household our proxy materials or notices to shareholders of record sharing an address. This means that shareholders of record who share an address will each be mailed a separate Notice Regarding the Availability of Proxy Materials. However, certain brokerage firms, banks, or similar entities holding our common stock for their customers may household proxy materials or notices. Shareholders sharing an address whose shares of our common stock are held in street name should contact their broker if they now receive (i) multiple copies of our proxy materials or notices and wish to receive only one copy of these materials per household in the future, or (ii) a single copy of our proxy materials or notice and wish to receive separate copies of these materials in the future. If shareholders received one set of materials due to householding, they may revoke their consent for future mailings at any time by contacting Broadridge Financial Solutions by telephone at 1-866-540-7095 or by mail at Broadridge Householding Department, 51 Mercedes Way, Edgewood, NY 11717. | | | | Notice of Annual Meeting of Shareholders and 2021 Proxy Statement | | | 72 |
General The cost of preparing, printing, and mailing this Proxy Statementproxy statement and of the solicitation of proxies by us will be borne by us. Solicitation will be made by mail and, in addition, may be made by our directors, officers, and employees personally or by telephone, email, or facsimile. We have engaged Innisfree M&A Incorporated, a professional proxy solicitation firm, to assist with the solicitation of proxies and provide consulting services. We will pay Innisfree a service fee of approximately $20,000, plus customary expenses for its assistance with the solicitation of proxies. We will request brokers, custodians, nominees, and other like parties to forward copies of proxy materials to beneficial owners of stock and will reimburse such parties for their reasonable and customary charges or expenses in this connection. We will provide to any person whose proxy is solicited by this proxy statement, without charge, upon written request to our Corporate Secretary, at 299 SW Clay Street, Suite 350, Portland, OR 97201, a copy of our Annual Report on Form10-K for the fiscal year ended August 31, 20182021 or a copy of our proxy statement. We also make available, free of charge on our website, all of our filings that are made electronically with the SEC, including Forms10-K,10-Q,10-K, 10-Q, and8-K. IT IS IMPORTANT THAT PROXIES BE PROVIDED PROMPTLY. THEREFORE, SHAREHOLDERS WHO DO NOT EXPECTEVEN IF YOU PLAN TO ATTEND THE VIRTUAL ANNUAL MEETING, IN PERSON ARE URGEDWE ENCOURAGE YOU TO SUBMIT A PROXY THROUGH THEVOTE BY INTERNET, OR BY TELEPHONE, OR MAIL IN ADVANCE OF THE MEETING SO YOUR VOTE WILL BE COUNTED IF YOU LATER DECIDE NOT TO EXECUTE AND RETURNOR CANNOT ATTEND THE ENCLOSED PROXY IN THE REPLY ENVELOPE PROVIDED IF THIS PROXY WAS RECEIVED BY MAIL.VIRTUAL ANNUAL MEETING. By Order of the Board of Directors  
Peter B. Saba Corporate Secretary December 19, 201815, 2021 | | | | | | | Notice of Annual Meeting of Shareholders and 20182021 Proxy Statement | | | | 67 | 73 |
Appendix A Non-GAAP Financial Measures This presentation contains performance based on adjusted EBITDA and adjusted diluted earnings (loss) per share from continuing operations attributable to the Company which are non-GAAP financial measures as defined under SEC rules. ROCE includes in its calculation adjusted net income which is also a non-GAAP financial measure. As required by SEC rules, the Company has provided a reconciliation of these measures for each period discussed to the most directly comparable U.S. GAAP measure. Management believes that providing these non-GAAP financial measures adds a meaningful presentation of the Company’s results from business operations excluding adjustments for legacy environmental matters (net of recoveries), business development costs not related to ongoing operations including pre-acquisition expenses, restructuring charges and other exit-related activities, charges related to non-ordinary course legal settlements, asset impairment charges (net of recoveries), recoveries related to the resale or modification of previously contracted shipments, and where applicable the income tax benefit allocated to these adjustments, items which are not related to underlying business operational performance, and improves the period-to-period comparability of the Company’s results from business operations. These non-GAAP financial measures should be considered in addition to, but not as a substitute for, the most directly comparable U.S. GAAP measures. | | | | | | | | | | | | | | | | | | | | | | | Adjusted EBITDA ($ in thousands) | | Fiscal Year | | | | 2021 | | | 2020 | | | 2019 | | | 2018 | | | 2017 | | | | | | | | Net income (loss) | | $ | 169,975 | | | $ | (2,200 | ) | | $ | 58,322 | | | $ | 159,789 | | | $ | 46,978 | | | | | | | | Loss (income) from discontinued operations, net of tax | | | 79 | | | | 95 | | | | 248 | | | | (346 | ) | | | 390 | | | | | | | | Interest expense | | | 5,285 | | | | 8,669 | | | | 8,266 | | | | 8,983 | | | | 8,081 | | | | | | | | Income tax expense (benefit) | | | 37,935 | | | | 166 | | | | 17,670 | | | | (17,590 | ) | | | 1,322 | | | | | | | | Depreciation and amortization | | | 58,599 | | | | 58,173 | | | | 53,336 | | | | 49,672 | | | | 49,840 | | | | | | | | Charges for legacy environmental matters, net(1) | | | 13,773 | | | | 4,097 | | | | 2,419 | | | | 7,268 | | | | 2,648 | | | | | | | | Business development costs | | | 2,155 | | | | 1,619 | | | | — | | | | — | | | | — | | | | | | | | Restructuring charges and other exit-related activities | | | 1,008 | | | | 8,993 | | | | 365 | | | | (661 | ) | | | (109 | ) | | | | | | | Charges related to legal settlements(2) | | | 400 | | | | 73 | | | | 2,330 | | | | — | | | | — | | | | | | | | Asset impairment charges (recoveries), net | | | — | | | | 5,729 | | | | 63 | | | | (1,021 | ) | | | (717 | ) | | | | | | | Recoveries related to the resale or modification of previously contracted shipments | | | — | | | | — | | | | — | | | | (417 | ) | | | (1,144 | ) | | | | | | | | | | | | | | | | | | | | | | | | | | | | Adjusted EBITDA | | $ | 289,209 | | | $ | 85,414 | | | $ | 143,019 | | | $ | 205,677 | | | $ | 107,289 | |
| (1) | Legal and environmental charges, net of recoveries, for legacy environmental matters including those related to the Portland Harbor Superfund site and to other legacy environmental loss contingencies. |
| (2) | Charges related to legal settlements in fiscal 2021 relate to a claim by a utility provider for past charges, and in fiscal 2020 and fiscal 2019 relate to the settlement of a wage and hour class action lawsuit. |
| | | | | | | | | | | | | | | | | | | | | | | Adjusted Diluted Earnings (Loss) Per Share from Continuing Operations Attributable to the Company ($ per share) | | Fiscal Year | | | | 2021 | | | 2020 | | | 2019 | | | 2018 | | | 2017 | | | | | | | | As reported | | $ | 5.66 | | | $ | (0.15 | ) | | $ | 2.01 | | | $ | 5.46 | | | $ | 1.60 | | | | | | | | Charges for legacy environmental matters, net(1) | | | 0.47 | | | | 0.15 | | | | 0.09 | | | | 0.25 | | | | 0.09 | | | | | | | | Business development costs | | | 0.07 | | | | 0.06 | | | | — | | | | — | | | | — | | | | | | | | Restructuring charges and other exit-related activities | | | 0.03 | | | | 0.32 | | | | 0.01 | | | | (0.02 | ) | | | — | | | | | | | | Charges related to legal settlements(2) | | | 0.01 | | | | — | | | | 0.08 | | | | — | | | | — | | | | | | | | Asset impairment charges | | | — | | | | 0.21 | | | | — | | | | (0.04 | ) | | | (0.03 | ) | | | | | | | Recoveries related to the resale or modification of previously contracted shipments | | | — | | | | — | | | | — | | | | (0.01 | ) | | | (0.04 | ) | | | | | | | Income tax (benefit) expense allocated to adjustments(3) | | | (0.13 | ) | | | (0.16 | ) | | | (0.03 | ) | | | — | | | | — | | | | | | | | | | | | | | | | | | | | | | | | | | | | | Adjusted(4) | | $ | 6.13 | | | $ | 0.43 | | | $ | 2.16 | | | $ | 5.64 | | | $ | 1.62 | |
| (1) | Legal and environmental charges, net of recoveries, for legacy environmental matters including those related to the Portland Harbor Superfund site and to other legacy environmental loss contingencies. |
| | | | Notice of Annual Meeting of Shareholders and 2021 Proxy Statement | | | A-1 |
| | | 
SCHNITZER STEEL INDUSTRIES, INC.
P.O. BOX 10047
PORTLAND, OREGON 97296
| | Vote
Appendix A |
| (2) | Charges related to legal settlements in fiscal 2021 relate to a claim by Internet, Telephone or Mail 24 Hours a Day, 7 Daysutility provider for past charges, and in fiscal 2020 and fiscal 2019 relate to the settlement of a Weekwage and hour class action lawsuit.
|
| (3) | VOTE BY INTERNET -www.proxyvote.com
UseIncome tax allocated to the Internetaggregate adjustments reconciling reported and adjusted diluted net income (loss) from continuing operations attributable to transmit your voting instructionsthe Company is determined based on a tax provision calculated with and without the adjustments.
|
| (4) | May not foot due to rounding. |
| | | | | | | | | | | | | | | | | | | | | | | Adjusted Net Income (Loss) from Continuing Operations Attributable to the Company ($ in thousands) | | Fiscal Year | | | | 2021 | | | 2020 | | | 2019 | | | 2018 | | | 2017 | | | | | | | | As reported | | $ | 165,191 | | | $ | (4,050 | ) | | $ | 56,593 | | | $ | 156,105 | | | $ | 44,901 | | | | | | | | Charges for legacy environmental matters, net(1) | | | 13,773 | | | | 4,097 | | | | 2,419 | | | | 7,268 | | | | 2,648 | | | | | | | | Business development costs | | | 2,155 | | | | 1,619 | | | | — | | | | — | | | | — | | | | | | | | Restructuring charges and other exit-related activities | | | 1,008 | | | | 8,993 | | | | 365 | | | | (661 | ) | | | (109 | ) | | | | | | | Charges related to legal settlements(2) | | | 400 | | | | 73 | | | | 2,330 | | | | — | | | | — | | | | | | | | Asset impairment charges (recoveries), net | | | — | | | | 5,729 | | | | 63 | | | | (1,021 | ) | | | (717 | ) | | | | | | | Recoveries related to the resale or modification of previously contracted shipments | | | — | | | | — | | | | — | | | | (417 | ) | | | (1,144 | ) | | | | | | | Income tax (benefit) expense allocated to adjustments(3) | | | (3,712 | ) | | | (4,494 | ) | | | (794 | ) | | | 34 | | | | (25 | ) | | | | | | | | | | | | | | | | | | | | | | | | | | | | Adjusted | | $ | 178,815 | | | $ | 11,967 | | | $ | 60,976 | | | $ | 161,308 | | | $ | 45,554 | | | | | | | | Interest expense (net of tax) | | | 4,308 | | | | 6,491 | | | | 6,389 | | | | 10,114 | | | | 7,866 | | | | | | | | | | | | | | | | | | | | | | | | | | | | | | | $ | 183,123 | | | $ | 18,458 | | | $ | 67,365 | | | $ | 171,422 | | | $ | 53,420 | | | | | | | | Average capital | | $ | 878,537 | | | $ | 866,802 | | | $ | 821,635 | | | $ | 757,355 | | | $ | 694,488 | | | | | | | | | | | | | | | | | | | | | | | | | | | | | ROCE | | | 20.8 | % | | | 2.1 | % | | | 8.2 | % | | | 22.6 | % | | | 7.7 | % |
| (1) | Legal and environmental charges, net of recoveries, for electronic delivery of information up until 11:59 p.m. Eastern Time on January 28, 2019. Have your proxy card in hand when you accesslegacy environmental matters including those related to the webPortland Harbor Superfund site and follow the instructions to obtain your records and to create an electronic voting instruction form. ELECTRONIC DELIVERY OF FUTURE PROXY MATERIALS
If you would like to reduce the costs incurred by our company in mailing proxy materials, you can consent to receiving all future proxy statements, proxy cards and annual reports electronically viae-mail or the Internet. To sign up for electronic delivery, please follow the instructions above to vote using the Internet and, when prompted, indicate that you agree to receive or access proxy materials electronically in future years.
VOTE BY PHONE -1-800-690-6903
Use any touch-tone telephone to transmit your voting instructions up until 11:59 p.m. Eastern Time on January 28, 2019. Have your proxy card in hand when you call and then follow the instructions.
VOTE BY MAIL
Mark, sign and date your proxy card and return it in the postage-paid envelope we have provided or return it to Vote Processing, c/o Broadridge, 51 Mercedes Way, Edgewood, NY 11717.
If you vote your proxy by Internet or by Telephone, you do NOT need to mail back your Proxy Card.other legacy environmental loss contingencies.
|
| (2) | Charges related to legal settlements in fiscal 2021 relate to a claim by a utility provider for past charges, and in fiscal 2020 and fiscal 2019 relate to the settlement of a wage and hour class action lawsuit. |
| (3) | Income tax allocated to the aggregate adjustments reconciling reported and adjusted net income (loss) from continuing operations attributable to the Company is determined based on a tax provision calculated with and without the adjustments. |
| | | | Notice of Annual Meeting of Shareholders and 2021 Proxy Statement | | | A-2 |
SCHNITZER STEEL INDUSTRIES, INC. 299 SW CLAY ST.
PORTLAND, OREGON 97201
SCAN TO
VIEW MATERIALS & VOTE
Vote by Internet, Telephone or Mail
24 Hours a Day, 7 Days a Week
VOTE BY INTERNET
Before The Meeting - Go to www.proxyvote.com or scan the QR Barcode above
Use the Internet to transmit your voting instructions and for electronic delivery of information up until 11:59 p.m. Eastern Time on January 24, 2022. Have your proxy card in hand when you access the web site and follow the instructions to obtain your records and to create an electronic voting instruction form.
During The Meeting—Go to www.virtualshareholdermeeting.com/SCHN2022
You may attend the meeting via the Internet and vote during the meeting. Have the information that is printed in the box marked by the arrow available and follow the instructions.
VOTE BY PHONE—1-800-690-6903
Use any touch-tone telephone to transmit your voting instructions up until 11:59 p.m. Eastern Time on January 24, 2022. Have your proxy card in hand when you call and then follow the instructions.
VOTE BY MAIL
Mark, sign and date your proxy card and return it in the postage-paid envelope we have provided or return it to Vote Processing, c/o Broadridge, 51 Mercedes Way, Edgewood, NY 11717.
If you vote your proxy by Internet or by Telephone, you do NOT need to mail back your Proxy Card.
TO VOTE, MARK BLOCKS BELOW IN BLUE OR BLACK INK AS FOLLOWS: E53741-P13574
D63128-P62376 KEEP THIS PORTION FOR YOUR RECORDS
— — — — — — — — — — — — — — — — — — — — — — — — — — — — — — — — — — — — — — — — — — — — — — — — — — — — — — — — — — — — — — — — — — — — — —
DETACH AND RETURN THIS PORTION ONLY
THIS PROXY CARD IS VALID ONLY WHEN SIGNED AND DATED. DETACH AND RETURN THIS PORTION ONLY
SCHNITZER STEEL INDUSTRIES, INC. For Withhold For All To withhold authority to vote for any individual All All Except nominee(s), mark “For All Except” and write the
The Board of Directors Recommends a Vote FOR all number(s) of the nominee(s) on the line below. nominees in Proposal 1 and FOR Proposals 2 and 3.
1. Election of directors
Nominees:
01) Rhonda D. Hunter 02) David L. Jahnke
For Against Abstain
2. To vote on an advisory resolution on executive compensation.
3. To ratify the selection of independent registered public accounting firm.
The proxies may vote in their discretion as to other matters which may come before the meeting.
Please sign exactly as your name(s) appear(s) on the Proxy. If held in joint tenancy, all persons should sign. Trustees, administrators, etc., should include title and authority. Corporations should provide full name of corporation and title of authorized officer signing the Proxy.
Signature [PLEASE SIGN WITHIN BOX] Date Signature (Joint Owners) Date
| | | | | | | | | | | | | | | | | | | | | | | | | SCHNITZER STEEL INDUSTRIES, INC. | | | | For All | | Withhold All | | For All Except | | To withhold authority to vote for any individual nominee(s), mark “For All Except” and write the number(s) of the nominee(s) on the line below.
| | | | | | | | | The Board of Directors Recommends a Vote FOR all nominees in Proposal 1 FOR Proposals 2 and 3. | | | | | | | | | | | | | | | | | | | | | | | | | | | | | | | | | | ☐ | | ☐ | | ☐ | | | | | | | | | 1. | | Election of directors | | | | | | | | | | | | | | | | | | | Nominees:
| | | | | | | | | | | | | | | | | | | 01) Rhonda D. Hunter
| | | | | | | | | | | | | | | | | | | 02) David L. Jahnke | | | | | | | | | | | | | | | | | | | | | | | | | 03) William D. Larsson | | | | | | | | | | | | | | | | | | | | | | | | | | | | | | | | | | | | | | | For | | Against | | Abstain | | | | | | | | | | 2. | | To vote on an advisory resolution on executive compensation. | | | | ☐ | | ☐ | | ☐ | | | | | | | | | | 3. | | To ratify the selection of independent registered public accounting firm. | | | | ☐ | | ☐ | | ☐ | | | | | | The proxies may vote in their discretion as to other matters which may come before the meeting. | | | | | | | | | | | | | | For address changes and/or comments, please check this box and write them on the back where indicated. | | ☐ | | | | | | | | | | | | | | | | | | | | | | | Please sign exactly as your name(s) appears on Proxy. If held in joint tenancy, all persons should sign. Trustees, administrators, etc., should include title and authority. Corporations should provide full name of corporation and title of authorized officer signing the Proxy. | | | | | | | | | | | | | | | | | | | | | | | | | | | | | | | | | | | | | |
| | | | | | | | | | | | | | | | | | | | | | | | | Signature [PLEASE SIGN WITHIN BOX] | | Date | | | | | | | | Signature (Joint Owners) | | Date | | | | | | |
SCHNITZER STEEL INDUSTRIES, INC.
ANNUAL MEETING OF SHAREHOLDERS
Tuesday, January 29, 2019
25, 2022 8:00 a.m. Pacific Time KOIN Center
Conference Center Room 202
222 SW Columbia Street
Portland, Oregon 97201
www.virtualshareholdermeeting.com/SCHN2022
Important Notice Regarding the Availability of Proxy Materials for the Annual Meeting of Shareholders to be Held on January 29, 2019:25, 2022: The Notice and Proxy Statement and Form10-K are available at www.proxyvote.com. For driving directions
Schnitzer Steel Industries, Inc. 299 SW Clay Street
Portland, Oregon 97201 proxy
This proxy is solicited by the Board of Directors for use at the Company’s Annual Meeting of Shareholders on January 25, 2022.
The shares of common stock of Schnitzer Steel Industries, Inc. (the “Company”) that you hold will be voted as you specify on the reverse side of this proxy.
If no choice is specified, the proxy will be voted “FOR” all nominees in Proposal 1 and “FOR” Proposal 2 and Proposal 3.
By signing the proxy, you revoke all prior proxies and appoint Tamara L. Lundgren and Richard D. Peach, and each of them with full power of substitution, to vote these shares on the matters shown on the reverse side and any other matters which may come before, the Annual Meeting please see the interactive map on our proxy website.and all adjournments or postponements thereof.
THIS PROXY, WHEN PROPERLY EXECUTED, WILL BE VOTED AS DIRECTED OR, IF NO DIRECTION IS GIVEN, WILL BE VOTED FOR ALL NOMINEES IN PROPOSAL 1 AND FOR PROPOSAL 2 AND PROPOSAL 3.
See reverse for voting instructions.
— — — — — — — — — — — — — — — — — — — — — — — — — — — — — — — — — — — — — — — — — — — — — — — — — — — — — — — — — — — — — — — — — — — — — —
E53742-P13574
| | | | | Schnitzer Steel Industries, Inc. | | | 299 SW Clay Street | | | Portland, Oregon 97201 | | proxy | | This proxy is solicited by the Board of Directors for use at the Company’s Annual Meeting of Shareholders on January 29, 2019. | | The shares of common stock of Schnitzer Steel Industries, Inc. (the “Company”) that you hold will be voted as you specify on thereverse side of this proxy. | | If no choice is specified, the proxy will be voted “FOR” all nominees in Proposal 1 and “FOR” Proposal 2 and Proposal 3. | | By signing the proxy, you revoke all prior proxies and appoint Tamara L. Lundgren and Richard D. Peach, and each of them with full power of substitution, to vote these shares on the matters shown on the reverse side and any other matters which may come before the Annual Meeting and all adjournments or postponements thereof. | | THIS PROXY, WHEN PROPERLY EXECUTED, WILL BE VOTED AS DIRECTED OR, IF NO DIRECTION IS GIVEN, WILL BE VOTEDFOR ALL NOMINEES IN PROPOSAL 1 ANDFOR PROPOSAL 2 AND PROPOSAL 3. |
| | | | | | | | | Address Changes/Comments:
| | | | | | | | | | | | | | | | | | | | | | | | | | | | | | |
| | | (If you noted any Address Changes/Comments above, please mark corresponding box on the reverse side.) | | See reverse for voting instructions. |
|


 PEOPLE
 PLANET
 PROFIT